The Devil in the Details: Challenges Reading IFRS 17 Statements
With the first series of annual statements published under the new IFRS 17 standard, is the new standard achieving the desired transparency and comparability, or is variability undermining these objectives?
The new IFRS 17 standard for accounting insurance contracts became mandatory for IFRS accounts starting January 1, 2023. This year insurance companies have presented their financial statements based on IFRS 17 for the first time.
It took nearly 18 years to transition to this fully developed insurance accounting standard since the interim standard IFRS 4 became effective in 2005. IFRS 17 aims to increase transparency and make insurance results more comparable across different companies, countries, and other industries.
The first annual results following the new standard have been published in recent weeks. We have analysed them, based solely on publicly available figures, to provide an initial assessment of the challenges faced by readers of insurance statements. In certain areas, there are significant differences in the relevant figures, making comparisons between companies difficult.
We have examined the annual reports of 20 insurance companies from around the world, including AEGON, Allianz Group, Aviva, AXA, Abu Dhabi National Takaful, BNP Paribas Cardif, China Life, CNP, Generali, Manulife, Munich Re, New China Life, Old Mutual Limited (South Africa), Phoenix, Ping An (China), Prudential plc, QBE (Australia), Sun Life, Samsung Life (Korea), and Tawuniya (Saudi Arabia).
CSM at the transition to IFRS 17
In accordance with IFRS 17, entities must apply the standard retrospectively unless impracticable. At the transition date, they must identify, recognise, and measure each group of insurance contracts as if IFRS 17 had always applied, remove any balances that wouldn’t exist under IFRS 17, and recognise any resulting net difference in equity.
However, for mature companies with long-term liabilities partially initiated decades ago, retrospective application proved to be impracticable. This is the reason why some simplifications for the transition from IFRS 4 to IFRS 17 have been allowed.
The Modified Retrospective Approach permits some modifications based on reasonable and supportable information available without undue cost or effort, aiming to achieve the closest outcome to a full retrospective application.
The Fair Value Approach is based on the potential outcome of an orderly transaction between market participants.
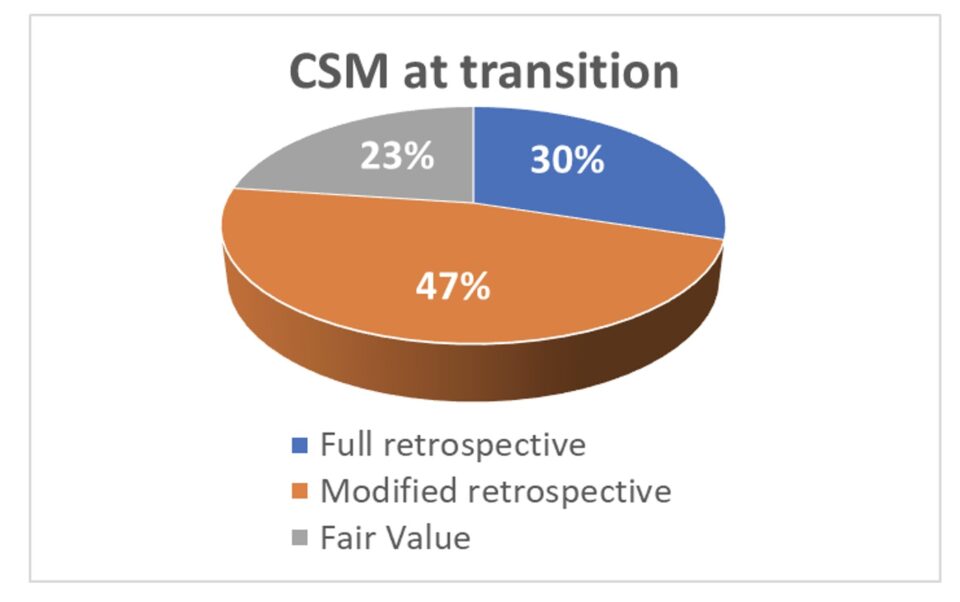
Less than one third of the portfolios in our sample have been treated in line with the full retrospective approach, and less than a quarter with the fair value approach. Almost half of the CSM stems from the modified retrospective approach.
However, there are significant differences by company: for Allianz, the modified retrospective approach was by far the most important (57%), as well as for the three Chinese companies: China Life (73%), New China Life (87%), and Ping An (76%). Companies mainly relying on the Fair Value Approach are Aviva (51%), Abu Dhabi National (63%), CNP (67%), and the Canadian companies Manulife (79%) and Sun Life (82%). For AXA, on the other hand, most of the CSM (73%) stems from the full retrospective approach.
Change of equity in the transition
The liabilities at transition are directly affected by the choices companies made regarding the transition methodology, the definition of Risk Adjustment, discounting, etc., finally resulting in a new equity position. It was generally expected that companies would try to present an attractive CSM as its releases will contribute to future results. This would translate into a reduction of equity. Furthermore, there will be a double impact on the return on equity: the numerator is increased while the denominator is decreased.
Indeed, 11 companies in our sample show an equity reduction of up to -23% (AEGON and Phoenix). Some companies, like AXA, BNP Paribas Cardif, and Ping An, show a relatively neutral equity position, whereas companies like CNP (+10%), Generali (+64%) and Munich Re (+29%) increased their equity, making ambitious return on equity targets more challenging.
The results align with a recent publication by the European regulator EIOPA, which analysed the half-year results of 53 insurance groups in the EU[1].
EIOPA also examined the level of liabilities compared to the Solvency II calculation, which impacts equity as well. They found that Solvency II technical provisions were, on average, 2.5% higher than the IFRS 17 fulfilment cash flows (the liabilities excluding the CSM), and for the General Model alone, even 7.5% higher. This is partially due to different cash flows but also due to higher discount rates, allowing for more illiquidity premiums in IFRS 17.
CSM in relation to the liabilities
The CSM contains the future profits, which will be released through profit and loss as the future service (coverage) is provided. There are certainly differences between the profitability of the business lines and the competitiveness of the markets. Therefore, different CSM levels can be expected. However, as the CSM is determined as a residual amount, considering the expected cash flows, discount rates, and Risk Adjustment, it not only reflects a pure profit margin but is also impacted by other effects.
Most companies present a CSM in the range of 4%-8% of the liabilities. However, there are several outliers: Tawuniya has not reported a CSM at all; China Life (16%), New China Life (15%), and Ping An (19%) have an exceptionally high CSM, potentially indicating higher profitability in the Chinese market. Furthermore, Munich Re (12%) and Prudential (15%) are showing a rather high CSM.
The change of the CSM from 2022 to 2023 is driven by the CSM built up by new business, reduced by the release of existing CSM. Munich Re is the only company in our sample keeping the CSM stable in this period; the European groups Allianz, AXA, and Generali achieved small growth of 1%-3%; Aviva (+21%), Manulife (+11%), and Phoenix (+23%) even an extraordinary growth. On the other hand, Abu Dhabi National lost 21% and QBE -38% of the CSM.
If the calculation of the CSM results in a negative amount, the corresponding group is considered onerous, the CSM is set to zero, and a loss component is established. The loss component as a percentage of the liabilities can give an indication of the proportion of loss-making business in the portfolio.
Most companies have a loss component in the range of 1%-5% of the liabilities. The outliers are AEGON (24%), Abu Dhabi National (65%), Old Mutual (12%), Phoenix (13%), and QBE (58%).
Basically, there could have been assumption changes driving business into an onerous position; however, given that the 2022 figures have been calculated for comparison only, it is not very likely that there are fundamental differences between the assumptions used in both years. Therefore, the above loss components rather stem from the transition.
Compared to disclosed premium deficiencies in the past, the above numbers seem high; however, the granular grouping of the contracts and the introduction of the cohorts eliminates potential cross-subsidy to a maximum degree.
Measurement models
IFRS 17 provides two alternative measurement models to the General Model or Building Block Approach (BBA): the Premium Allocation Approach (PAA) for short-term contracts and the Variable Fee Approach (VFA) for directly participating businesses. In our sample, only 9.1% of the liability for remaining coverage is based on the PAA. This apparently depends heavily on the business mix: according to the study by EIOPA, 90% of the non-life liabilities are mainly valued using the PAA, whereas for life insurance, the VFA was used for 86%, and the BBA for the remaining 14%.[2]
Risk adjustment
IFRS 17 requires insurers to adjust the estimated present value of future cash flows to account for the compensation needed for bearing uncertainty about the amount and timing of those cash flows due to non-financial risks. The corresponding explicit allowance is the Risk Adjustment.
Given the minimum, purely qualitative guidance IFRS 17 provides to calculate the Risk Adjustment for non-financial risks; you could expect a wide range of outcomes when comparing the Risk Adjustment to the total liabilities.
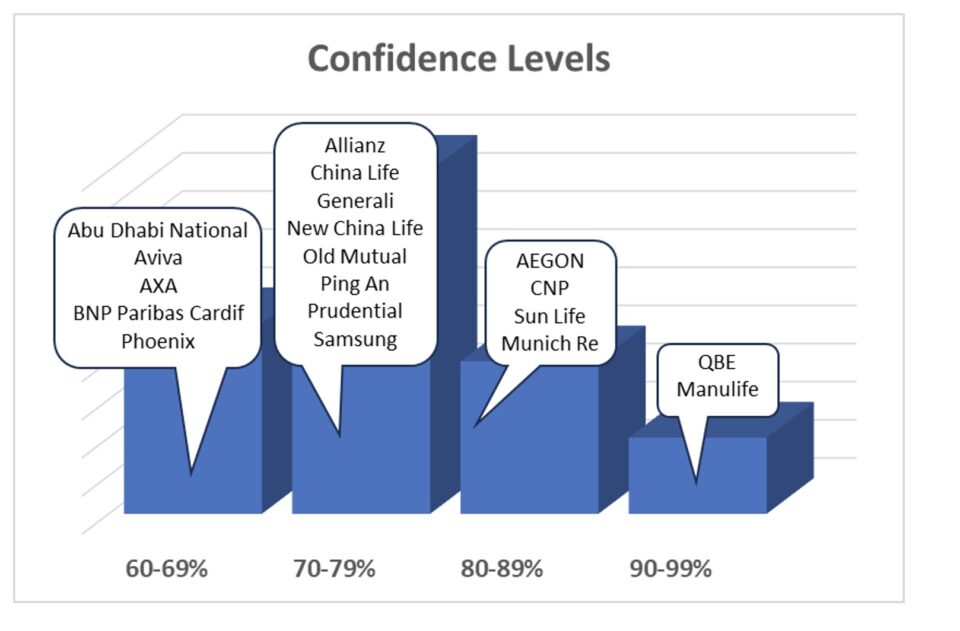
Surprisingly, most companies’ Risk Adjustment is in the range of 1%-2% of the liabilities, with Manulife (5%), QBE (7%), and Sun Life (6%) being the outliers. Manulife is setting a high confidence level (90%-95%), QBE with 90% as well, whereas the one of Sun Life (80%-85%) is significantly lower – so the lower Risk Adjustment of Manulife may be due to a combination of methodology and portfolio properties.
The risk appetite of the companies, reflected in the confidence levels, varies significantly and ranges from 60% to 95%[3].
Furthermore, the companies used a variety of methods to determine the Risk Adjustment:
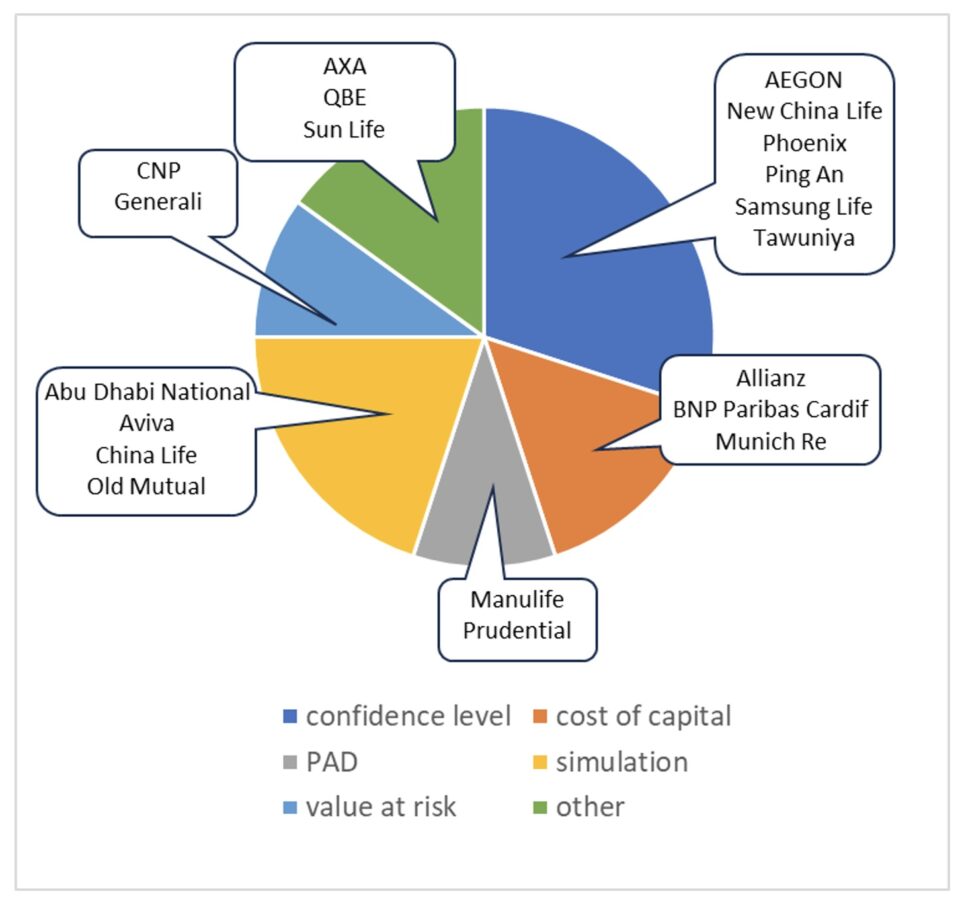
The above categories are not clearly distinct; we just relied on the descriptions provided by the companies in the annual reports.
EIOPA has analysed the differences between the Solvency II Risk Margin and the IFRS 17 Risk Adjustment and found that the Risk Adjustment is 33% lower for life business in the General Model and 44% lower for contracts in the Variable Fee Approach; for non-life business, however, the Risk Adjustment is 11% higher on average.
Split of the contract liabilities
The overall split of the contract liabilities into the present value of cash flows, Risk Adjustment, and CSM for our sample looks as follows:
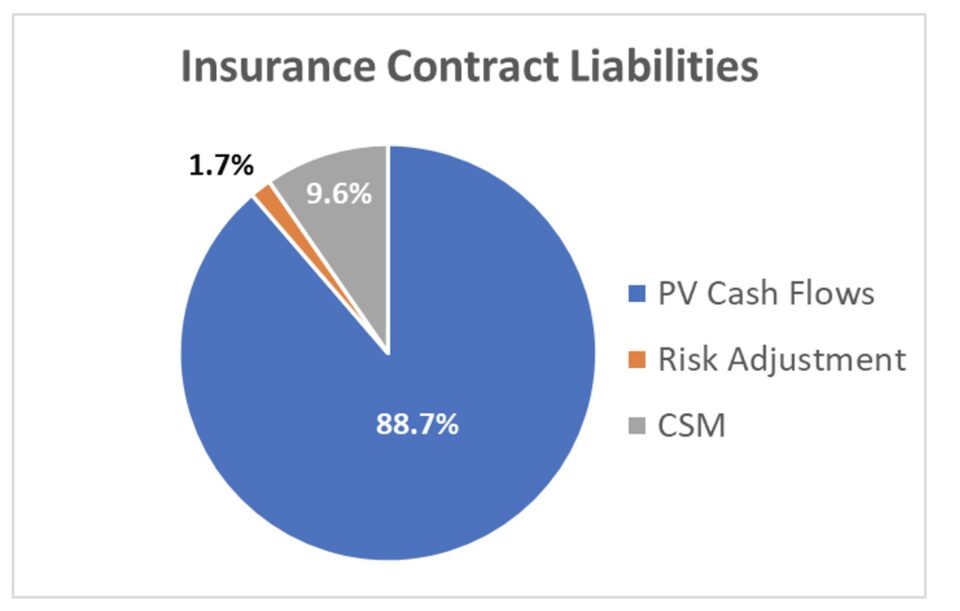
As we have seen in previous paragraphs, the split for specific companies can differ a lot.
Discounting
The disclosures of the interest rates used for discounting the liabilities vary by company: most companies list the rates for certain durations (e.g. 1, 5, 10, 20, 30 years), some even indicating an ultimate rate for very long durations. Others just publish a range of rates used (either by duration buckets or overall).
Many companies use different rates for BBA/PAA than for VFA – with VFA rates being more conservative.
Some companies vary the rates even further by product type: e.g. in many cases, the discount rates for immediate annuities are higher due to more illiquidity premium.
Change of insurance service result
The impact of assumption changes on the result is supposed to be buffered by the CSM (up to a certain degree) and companies can choose whether the impact of changing discount rates flows through the profit and loss or through Other Comprehensive Income – in the Variable Fee Approach, the CSM even serves as a buffer for market volatility.
We can only look at the result change from 2022 to 2023, which limits the meaningfulness of any statements on result volatility.
The clear outlier is Abu Dhabi National, showing a drop in the result of -125% and an increase in claims of 24%. On the other hand, Aviva and AXA showed a significant increase in their results of more than 50%. In general, there is no correlation between higher claims and lower results (and vice versa).
Reinsurance
Reinsurance has been an area of many debates during the development of IFRS 17. There is a series of mismatches between the underlying business and the corresponding reinsurance, which are simply given by the standard. So, we would expect a wide variety of outcomes due to the difficult starting point. First of all, reinsurance can be in a liability or an asset position, which has to be reported separately – supposedly to increase transparency. Reinsurance liabilities are normally very small or even 0. In the case of reinsurance assets, there are three outliers with significant reinsurance: Abu Dhabi National (27% of the liability), QBE (29%), and Tawuniya (26%).
Given the minor importance of reinsurance liabilities, let us focus on reinsurance assets only (in this context, we also may ask ourselves whether the separate reporting is merely an academic exercise that is not really relevant in practice). In general, the Risk Adjustment for Reinsurance Held can differ from the one for the underlying business due to reinsurance structure, price, diversification, etc. In fact, the relative size is much bigger than the one for the business in general, for some companies in a very significant order: e.g., China Life (30.8% vs. 0.8%) and Sun Life (59.9% vs. 6.2%).
The CSM for Reinsurance Held is normally different than the one for the underlying business – mainly driven by a different reinsurance price and the fact that the reinsurer normally does not participate in the acquisition expenses. Unlike for the direct business, the CSM can be positive (16 companies) or negative (1 company).
Reporting of non-IFRS items
Premiums are no longer part of the income statements; nevertheless, they remain an important growth indicator for the companies. Therefore, most of them still report premiums in their reports. This is not very surprising.
However, more importantly, some companies publish additional figures which are supposed to better reflect the business performance, in the case of Allianz, for instance, “operating profit” and “shareholders’ core net income”.
References
[1] , [2]European Insurance and Occupational Pensions Authority: “IFRS 17 – Insurance Contracts report”, 15 April 2024
[3] Please note that in the above graph, we used the lifetime confidence level of 61% reported by Phoenix. The one-year confidence level is 80%.
This article first appeared on SSRN and is being republished on our platform with the authors’ permission.
CPD: Actuaries Institute Members can claim two CPD points for every hour of reading articles on Actuaries Digital.