Finding the Data Analytics Unicorn
Amanda Aitken reviews the key ideas explored at the Actuaries Institute’s inaugural Data Analytics Seminar, 2015.
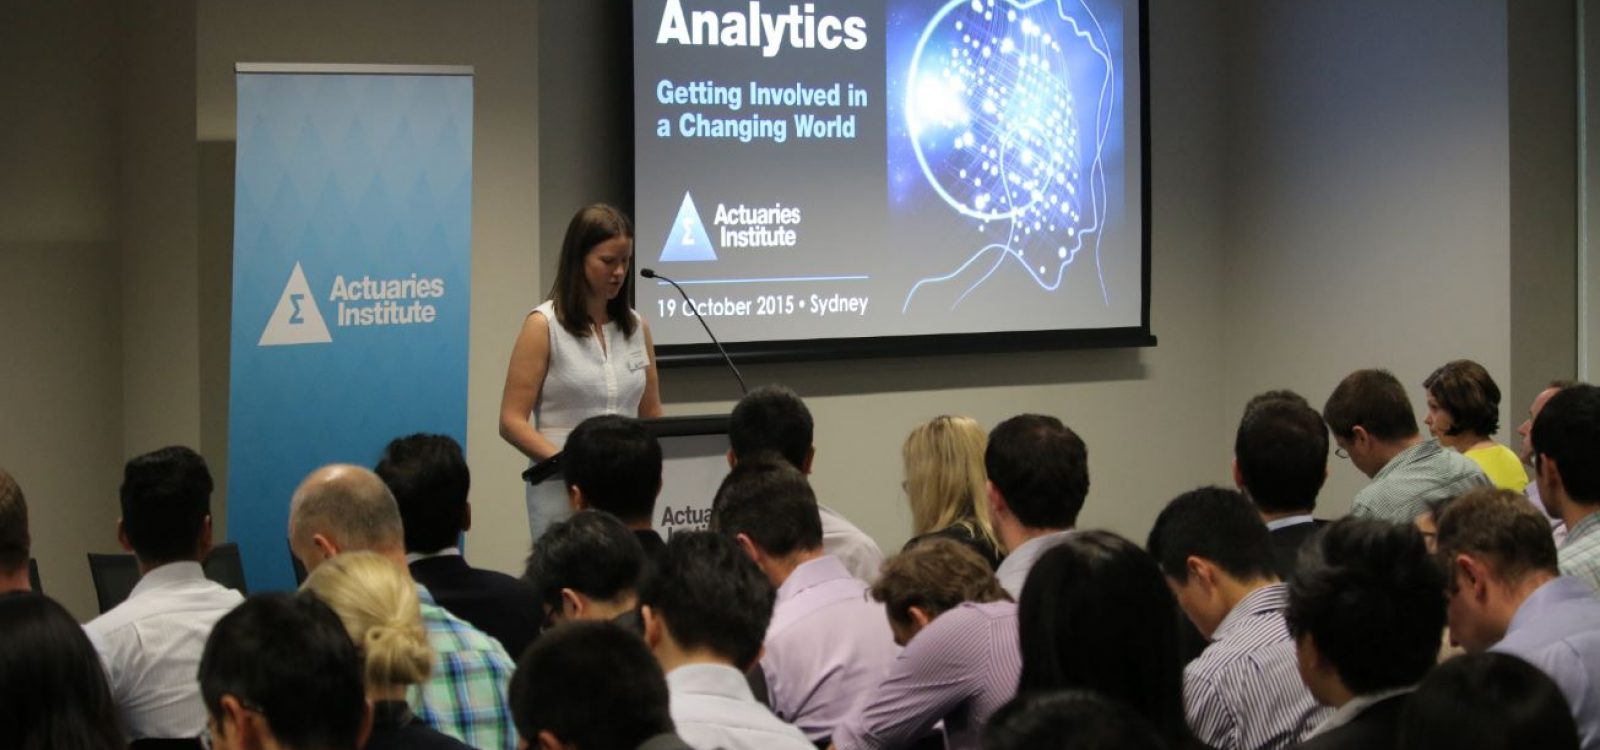
I imagine it’s not tha t often that an Actuaries Institute function is sold out well in advance of the event. That was, however, the case for the Institute’s first Data Analytics Seminar, organised by the Data Analytics Working Group.
Over 100 people descended on the Institute’s headquarters on 19 October for this inaugural event and if audience interaction was anything to go by, they weren’t disappointed with the smorgasbord of speakers who presented on the day.
The seminar was focussed towards actuaries new to the field of Data Analytics. Often, not surprisingly, these actuaries might be confused by Data Analytics buzz words such as structured and unstructured data; data pipelines; Hadoop, Hive and Vowpal Wabbit; bagging, blending and boosting. Chris Dolman, Director of Data at IAG, reflected that hype, such as that surrounding Data Analytics, can be infectious and often when there’s hype, there are buzz words, which can both drive the hype and become a symptom of it.
Rami Mukhtar (Ambiata), Hugh Miller (Taylor Fry) and Rachael McNaughton (Towers Watson) helped to debunk some of this hype by talking about the various tools and techniques of Data Analytics, reminding the audience that most of the work is in the data preparation stage, with machine learning being “the easy bit”! Several machine learning techniques were discussed including supervised learning algorithms like neural networks (“GLMs on steroids”) and decision trees, and unsupervised learning techniques such as principal components analysis and k-means clustering.
All three presentations (link below) included some excellent reference materials for audience members wanting to learn more.
Data Analytics Principles
Key aspects of the Data Analytics process were outlined, including:
- understanding the business need (not to be underestimated in its importance)
- data collection
- data cleaning/feature preparation (can be 95% of the work)
- the science experiment, with machine learning at its core (“the fun part”)
- communicating the findings
- converting the findings into business action
Rachael McNaughton reflected that what has changed in this process over time is that there are now new data sources and new techniques available. Additionally, cross validation, a process which helps to evaluate how well a model will generalise to new data, has become the gold standard of machine learning.
Analytics in Operation
Several real life examples were used throughout the day to highlight the value that Data Analytics can bring to business. These included:
- a US sports store that increased sales by targeting products based on weather patterns;
- Qantas flight attendants being armed with Data Analytics powered devices to tell them which high potential customers to pamper the most in-flight;
- Netflix’s use of Data Analytics to help create new shows that will appeal to the masses, such as House of Cards and Orange is the New Black; and
- Barack Obama using analytics to inform what topics to focus on in his presidential addresses.
Vaughan Chandler (Qantas) talked about Data Analytics being the central nervous system of their business and how it is now used across many areas such as marketing, strategy, capital allocation, loyalty, customer service, product design and pricing.
Aaron Cutter (Finity) highlighted one of the more unique uses of Data Analytics; a Hong Kong based company with an algorithm as an official board member, with as much voting right as any human member.
All of these examples helped to highlight that Data Analytics is being used by a wide variety of businesses, to help solve an array of business issues in new and creative ways.
Challenges
Some of the challenges of working in the Data Analytics area were discussed including that Data Analytics can’t be successful in a vacuum. It needs to align with all aspects of a business such as operations, merchandise and marketing. Kate Box (Facebook) provided an example of a highly effective retail marketing campaign, driven by Data Analytics, backfiring because stock levels couldn’t keep up with demand.
Working in the area of Data Analytics, you will sometimes find yourself “locking horns” with business teams who aren’t used to, or comfortable with, working in new ways. In particular, those working in Data Analytics often want to experiment with as much (varied) data as possible which often conflicts with the data warehouse team’s desire for structure and rigidity in data collected.
Daniel Marlay (Ernst & Young) highlighted some of the communication challenges, including the need to explain experimentation to non-scientists, the importance of knowing who your audience is and providing either an outcome focus to senior management or using a narrative style with lots of detail for more technical audiences.
Where do Actuaries Fit In?
Throughout the sessions, there was a lot of discussion about how difficult it is to find someone with the right skill set who has technical expertise, an entrepreneurial mind and an ability to talk in a language that management can understand. Chris Dolman identified this individual as the “Data Analytics unicorn” and suggested that when that right combination can’t be found in a single individual, you need to create a team to meet all of these needs. For example, Qantas use management consultants to lead their analytics team to try to find this ideal balance between technical skill and the ability to effect change. Uma Joshi (QBE) suggested that Actuaries are ideally placed to provide not only technical ability, but also business acumen and an ability to communicate complex results simply.
In addition, the Data Analytics process is cyclical in nature; after identifying the business need and exploring the data, it is often necessary to go back to the business to redefine the objective and continue the process again. Similarly, after cleaning the data and processing it, the machine learning results may require you to go back and look for alternative data sources. Sounds very much like the Actuarial Control Cycle to me!
Some Seasoned Advice
For those new to this field of work, here are a few tips offered by several of the presenters:
- Getting your data perfect is not always worth the investment. “Dirty data” can still create operational advantages, but, as Mitch Prevett (Quantium) pointed out, you need to know why and where it’s dirty.
- Understand the business objective. Ask your client what success will look like. Understand who are you reporting to and what’s relevant for them. In addition, when selecting models, make sure you consider the business issue.

- Learn how to measure the value of your work. Do this by working out what the business values and what makes stakeholders tick.
- Say yes to the right projects and no to those that won’t add value.
- Make yourself known to the CEO. Aaron Cutter suggested that as companies become more aware of what data can do for them, there’s a growing trend of CEOs wanting to keep their data analysts close by.
- You need to understand where different people are coming from. Chris Dolman explained that when it comes to Data Analytics, people tend to fall into four categories: sceptics (do something useful for them quickly and don’t dumb it down), allies (will support you in the wider business – keep them satisfied), fearful (understand their goals and help create non-threatening projects) and dangerous (learn to say no).
How to Get Started
With so many opportunities in the Data Analytics space, how should you get started?
Firstly, have a look at the presentations from the Seminar (members only).
You might like to undertake an online course such as those offered by www.edx.org or www.coursera.org.
To develop, or perhaps show off, your skills, sign up for the Data Analytics Working Group’s Kaggle competition. You can find out more here.
Finally, you should join the Institute’s new Data Analytics Community on LinkedIn and start sharing ideas with other like-minded Actuaries.
Good luck!
CPD: Actuaries Institute Members can claim two CPD points for every hour of reading articles on Actuaries Digital.


