
Make Actuaries Generate Analytics: A serial Twitter analysis for the 2020 US Presidential Election by YDAWG Analytica
With the 2020 US Presidential Election just around the corner, the Young Data Analytics Working Group (YDAWG) meandered on a data analytics adventure into the twittersphere to see what the candidates, parties and public have been saying and used a Machine Learning algorithm to mimic the candidates’ tweets. This is a sequel to our 2019 Australian Federal Election Twitter analysis.
For better or worse, Twitter has become one of the most powerful media platforms used by news stations and politicians alike to share their messages, connect with constituents, and influence public debates. With the 2020 US Presidential Election on 3 November (4 November AEST), a few members of the YDAWG put their curious minds together to investigate what the candidates, parties and the public are saying about the election.
Without aiming to predict the results, this pre-election analysis aims to showcase analysis that can be undertaken on the Twitter coverage of the election in the three months leading up to the vote.
What do the candidates and parties tweet most about?
Analysing the most frequent keywords in the tweets gives us an overview of the candidates and the two parties main messages and agendas. It could also unveil their different campaign strategies, for example:
- What are the one or two issues that the candidates are pushing?
- Are they running positive or negative campaigns?
- How often do they directly call out each other?
To investigate this, historical tweets were sourced from the following accounts:
- @realDonaldTrump
- @JoeBiden
- @GOP
- @TheDemocrats
The July to October 2020 period was chosen given both candidates have been focusing on campaigning during this period. After some data cleansing and removing retweets, the clean tweets are ready to be explored.
The keywords for the four accounts are below:
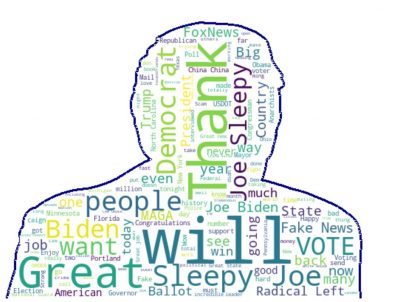
@realDonaldTrump: There are 146,902 words in the combination of all tweets
@JoeBiden: There are 373,058 words in the combination of all tweets
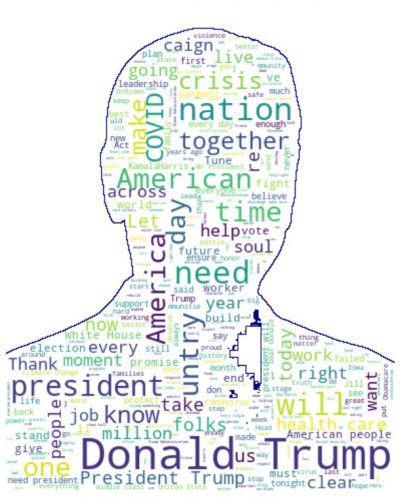
The size of a keyword reflects the frequency of its usage. It can be seen that both candidates have frequently called out each other on Twitter (directly and via nickname), reflecting the heightened tension between the two sides. During this time of crisis, both candidates seeked to inspire, lead, and promise a better future, which is evident from the frequent usage of keywords such as ‘great’, ‘people’, ‘unity’, etc. It would also appear, purely based on these limited number of tweets, that Biden had more explicit mentions of COVID and particular campaign issues, e.g. ‘healthcare’ and ‘job’.
Looking over to the two parties:
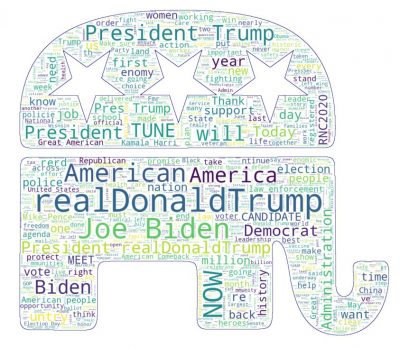
@GOP: There are 281,297 words in the combination of all tweets.
@TheDemocrats: There are 301,014 words in the combination of all tweets
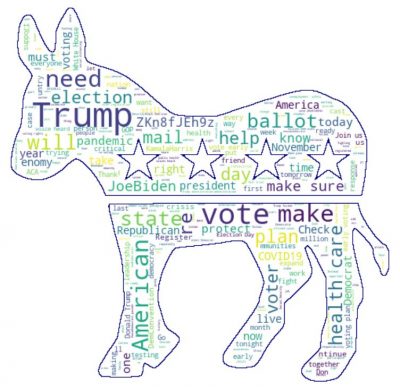
We can see that the two parties’ messagings are clearly aligned to that of their respective candidates. In addition to the name calling, the GOP’s law and order theme is visible from the use of words such as ‘police’ while the Democrats echoing themes such as ‘healthcare’.
Investigate frequency of key topics using Scattertext
Using a python package called Scattertext, we can visualise the tweets and search (in the html format) for words which will then receive the frequency of the searched word by the two candidates. In addition, hovering around the words in the texts gives some info/location.
Words or phrases which appear close to the upper-left and lower-right corners differentiate the parties in terms of policy divisions. For example, terms such as ‘MAGA’, ‘crazy’, ‘Fake News’ are frequently used by Trump but almost never used by Biden. Likewise, terms such as ‘folks’, ‘crisis’, ‘soul’ are frequently used by Biden but almost never used by Trump. Terms that are frequently used in the total sample tweets are displayed on the far-right of the visualisation.
Are the campaigns really that negative?
The 2020 presidential campaign has been criticised for being overly negative filled with attacks and rhetoric, as opposed to being issue-led and offering substance. We categorised the tweets into Positive and Negative sentiments using TextBlob, which contains several sentiment lexicons in the sentiments dataset.
|
|
Positive |
Neutral |
Negative |
|
@realDonaldTrump |
35.87% |
43.70% |
20.44% |
|
@JoeBiden |
41.67% |
42.66% |
15.67% |
|
@GOP |
47.47% |
40.22% |
12.31% |
|
@TheDemocrats |
42.57% |
42.57% |
14.86% |
Interestingly, all four accounts show similar breakdowns among positive, negative, and neutral sentiments. Trump and the GOP do show slightly higher negativity but the difference is not too material. Overall, all four accounts show a high degree of positivity in their tweets and the percentage for tweets with positive sentiment generally doubles that with negative sentiment!
Clearly, the above results should be taken with a grain of salt. The TextBlob package uses lexicon-based techniques to conduct sentiment analysis – these techniques are computationally efficient and scalable, but do not work well with complex linguistic rules.
What is the public sentiment towards the candidates?
We can use similar a technique as the above to understand the public’s sentiment by analysing a set of tweets that contain keywords related to the two candidates and parties. Whilst our analysis is simple and high level, the insights it has generated can be quite useful to campaign staff, strategists, and political pundits looking for an audience. We analysed below circa 1000 tweets for each side.
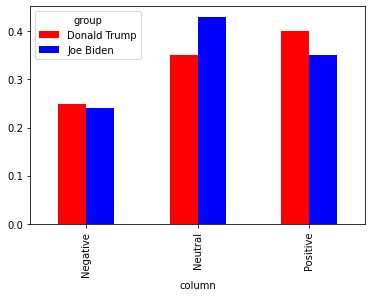
Donald Trump and GOP – keywords: ‘Donald Trump’, ‘Republican’
Joe Biden and Democrat – keywords: ‘Joe Biden’, ‘Biden’, ‘Democrat’
Interestly, out of the sample tweets, Donald Trump appears to have more polarised public sentiment, having higher percentages for both positive sentiment and negative sentiment compared to Biden. The public’s sentiment towards Joe Biden is more neutral. Given the significant portion of neutral sentiment, perhaps many people are still somewhat undecided. Could this be foreshadowing a tight race that will be too close to call?
Impersonating the candidates
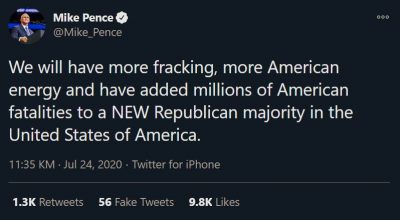
And now we’re armed with some deep knowledge of the candidates’ twitter accounts, why don’t we try to have a go at creating some tweets in their likeness? In order not to create too damaging of a force against democracy, let’s keep it really simple and use a basic Markov chain model.
A Markov chain is a mathematical system that experiences transitions from one state to another according to certain probabilistic rules.
In our case, each state will be a word and so the Markov chain will be used to predict the probability of any given word coming up next as based on the current word. These probabilities are calculated by looking at the frequency with which each word follows another in the training set. We can train our Markov chain model on the tweets we have gathered from each candidate and now we have ourselves a fake news bot that churns out 2,000 tweets a second:


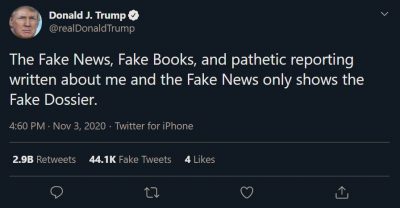
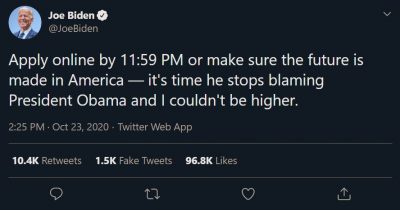


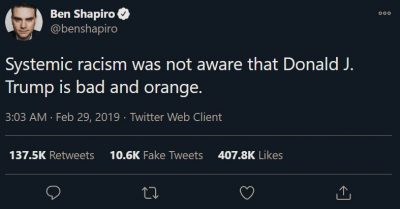
And while we’re at it, let’s prepare to flood the rest of the political twitterverse:


Just to round everything out, yDAWG Analytica has also had a go at giving our fake tweets a fake voice, with our tongue firmly planted in our cheek. And who better than the man who coined the term ‘Fake News’ himself, Donald Trump:
Audio PlayerThis sound byte was generated using a modified WaveRNN (single-layer recurrent neural net) trained on eight hours of Trump audio and accompanying transcript. The trained model is able to link every typed character/word to a sound byte and subsequently figures out how to generate these sounds itself. It also determines its own rules for combining groups of letters and pieces of audio in a way that best suits the given training data. This allows us to type in anything we want and have a poor Trump impersonator vocalise it.
While no human would be fooled by the clips produced by this particular model, this is a very basic setup that requires limited expertise to set up and little computing power to run (the laptop we are using can produce five seconds of audio every second). With some more sophisticated models, you can reach a much higher level of realism, including the digitally created lip synching from existing still pictures. An example below of President Trump.
So we gave that a go too, using ‘First Order Motion Model for Image Animation’ to get a static image of President Trump to match our movements, with the audio generated by WaveRNN… leading to this ‘animated’ result:
Audio PlayerFor more cool analysis on the US Presidential Election, we would like to point you to FiveFiftyEight.com which has built a forecasting model to predict state primaries results.
Conclusion
With the vast amount of data available to be utilised, Twitter has proven to be a gold mine for extracting powerful insights to understand the dynamics of political campaigns and public sentiment. Indeed, the fun exercise we went through only scratches the surface and much more can be done to take the analysis to another level, e.g. using machine learning models to study public sentiment based on tweets to predict election outcome. Fortunately with the election just around the corner, we will have a large volume of data ready to be analysed.
CPD: Actuaries Institute Members can claim two CPD points for every hour of reading articles on Actuaries Digital.


