
Update on Mortality in Australia
The ABS has released the weekly mortality statistics up to 28 July in Australia (for doctor-certified deaths only, excluding coroner-referred deaths). We’ve analysed this to update our previous analysis up to 30 June.[i]
- Throughout June and July, deaths were generally significantly lower than predicted, because the normal winter ‘hump’ did not eventuate.
- We continued to have very low deaths from all respiratory causes. We hypothesise that respiratory diseases are not circulating through the community as they have done in previous winters because of the continuation of social distancing measures throughout Australia and perhaps also because of the closed international borders.
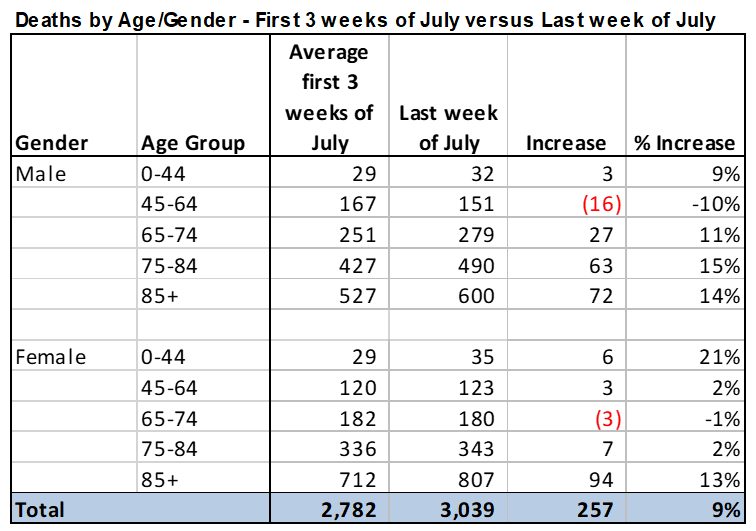
- Deaths jumped in the final week of July. While this was due in part to COVID-19, most of the extra deaths were identified as due to other causes, including dementia, diabetes and ‘other’. This coincided with a high number of diagnosed COVID-19 cases as the second wave approached its peak in Victoria.
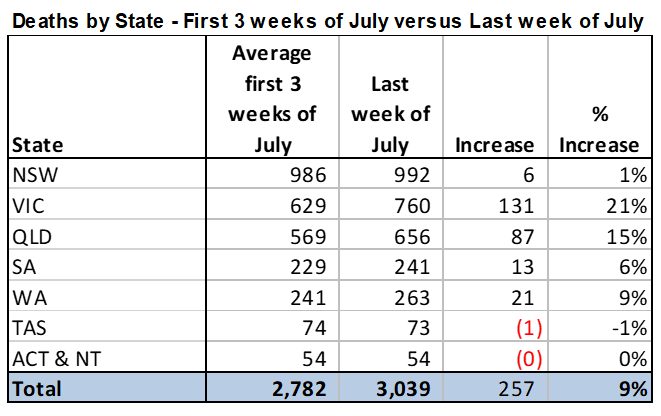
- From the state-based data, we can see that Victoria accounts for more than half of this spike, with a material increase also in Queensland.
- From the age-based data, we can see that males over 75 and females over 85 accounted for almost 90% of the spike.
- We surmise that the increase in deaths in the last week of July may be connected to difficulties in providing adequate care in aged care homes in Victoria at the time.
- Infection rates by age across Australia show that those over 90 in Victoria are most likely to be diagnosed with COVID-19.
- Suicide data from Victoria up to the end of October suggests that there has been no increase in suicides during the lockdown period in that state. Similarly, data from NSW shows no increase in suicides in the nine months to end-September 2020 compared with the previous year. However, given that suicide risk reflects the cumulative effects of stressors over time and the economic impacts of the lockdowns are expected to continue for some time, the ultimate impact may yet to be seen in suicide rates.
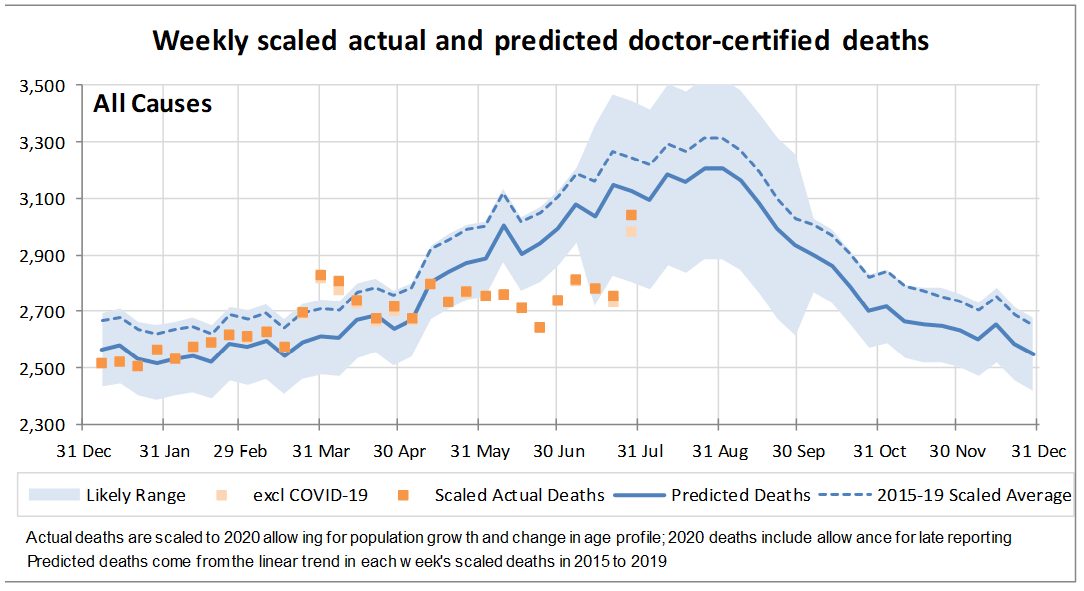
Low deaths in June and July
Throughout June and July, deaths were generally significantly lower than predicted, because the normal winter ‘hump’ did not materialise.
This was because of continued lower levels of respiratory illness in the community, emerging as a reduction in deaths from all respiratory illnesses (comprising influenza, pneumonia, chronic lower respiratory disease and other respiratory disease).
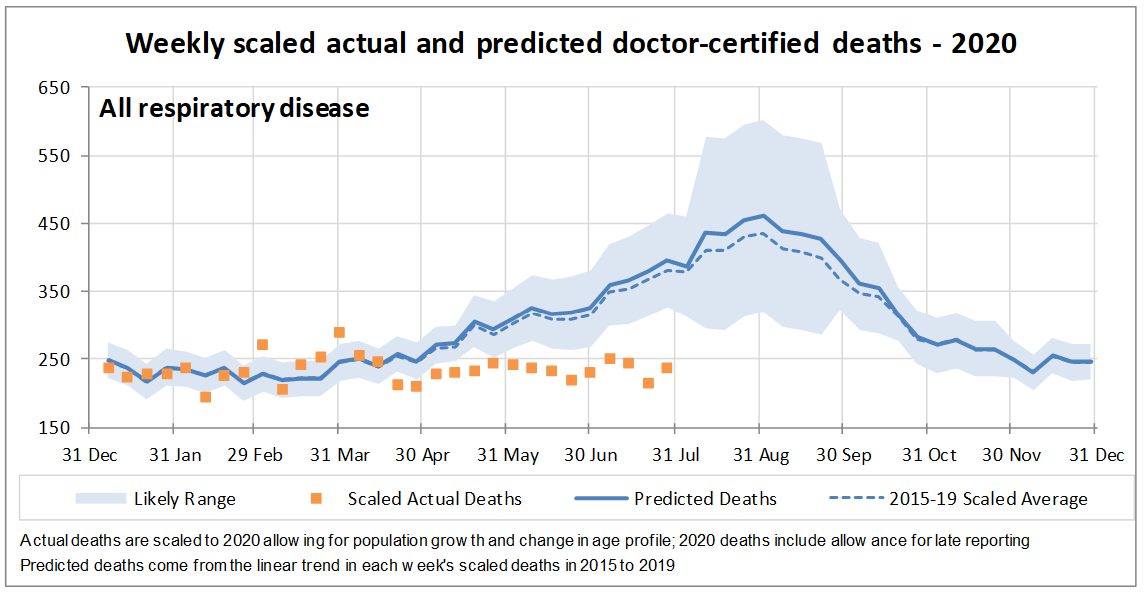
Interestingly, there have also been substantial reductions in deaths from dementia and ‘other causes’ (being those not specifically reported on in the ABS data). Deaths from these causes usually increase in winter (but haven’t increased this year) and we suspect that this reflects the stress that respiratory illness circulating in a normal winter can place on those with existing conditions.
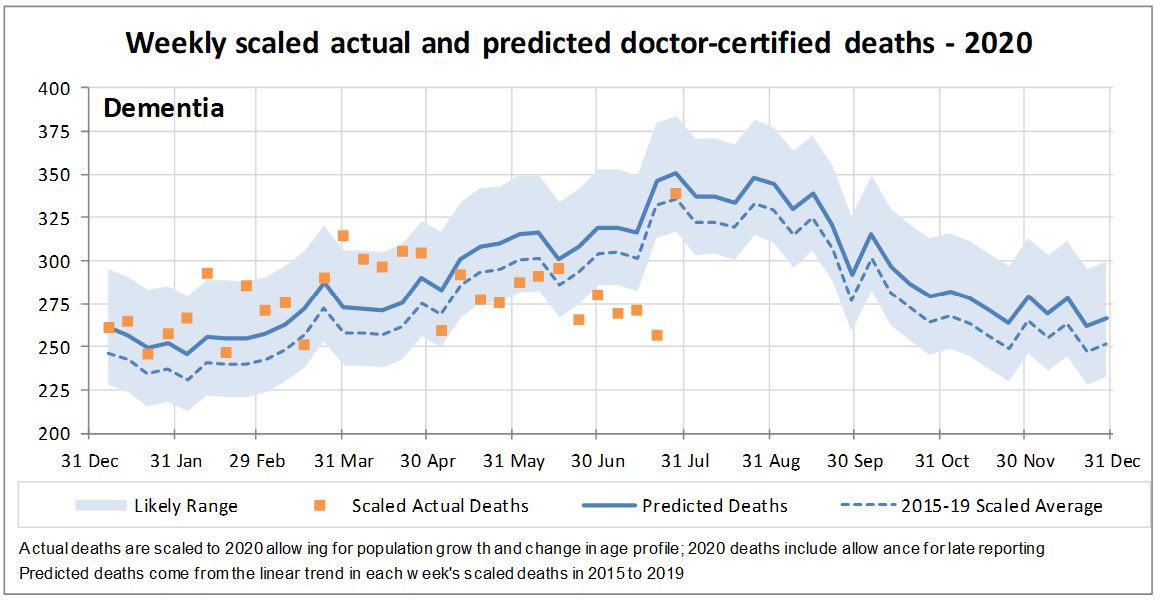
Dementia
The graph below shows that, for deaths caused by dementia, there is usually an increase in deaths over the winter months. This has not occurred this year.
You can also see that there was a striking rise in the final week of July, to the highest level in a single week for the whole of 2020. There is no reason to attribute this to seasonal influences given that the usual seasonal impact on dementia deaths is likely due to respiratory illness, and respiratory illness continues to be low. Given the simultaneous spike in COVID-19 cases in Victoria, we suspect that some of these deaths were caused by undiagnosed COVID-19 and some may also be the result of the provision of less than ideal levels of care in aged care homes that were dealing with an influx of COVID-19 cases.
The late-July spike
In the last week of July, there were 55 doctor-certified deaths from COVID-19, up from 17 the week before[ii]. As we have seen, deaths from dementia also jumped. In fact, deaths from diabetes, heart disease, cerebrovascular disease (stroke, etc) and ‘other causes’ were also at least 9% higher than the average for the first three weeks of the month.
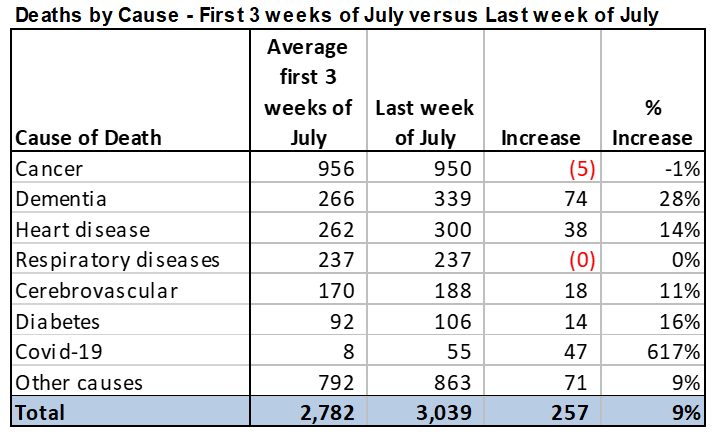
As for the deaths from dementia, some of these extra deaths could be from undiagnosed COVID-19 cases. Others may relate to delays in seeking treatment. However, many may simply be the consequence of the understaffing and poor care in aged care homes in Victoria as COVID-19 swept through many facilities.
This table shows that the extra deaths have largely come from males aged over 75 and females aged over 85, so many of them would have occurred in aged care, whether because of poor care, or undiagnosed COVID-19 cases:
This is further supported by the fact that over half of the increase has occurred in Victoria:
Suicides
There has been considerable concern over mental health impacts of lockdowns, and the wider economic downturn caused by lockdowns and other non-pharmaceutical health measures. The Coroners Court of Victoria has updated its provisional statistics on suicide and, reassuringly, there is no evidence of any increase in suicide over the second lockdown period of July through to October in Victoria. In fact, the months of September and October 2020 have the lowest numbers of suicide deaths of the three years shown. While this does not preclude longer-term mental health impacts, it is good to see that the immediate impacts have not led to increases in suicide rates.

NSW Health has released for the first time provisional suicide data from its new suicide monitoring system (similar to the Victorian Suicide Register, and based on data collected by NSW Police and the State Coroner). The data showed that the number of suicides to 30 September 2020 was 673; only one more death than for the same nine-month period in 2019.[iii] After adjusting for the growth in population, this actually represents a small reduction in the rate of death from suicide.

While there was no discernible increase in suicide deaths in NSW during the lockdown period (March to May) compared with the previous year, the number of suicides in July and August 2020 were higher than in 2019. However, this was followed by a lower number of suicide deaths in September 2020 compared with September 2019. As data is unfortunately only available for the two years shown, it is difficult to read much into the monthly data points.
Case fatality rate
The overall case fatality rate (deaths from COVID-19 divided by diagnosed cases) at 4 November is 3.3% for Australia as a whole[iv]. We urge caution when using case fatality rates. They could be too high if, as in most populations, the diagnosed cases of COVID-19 are underestimated (as not all asymptomatic or minor cases are tested, even when testing is quite comprehensive), and too low if not all deaths from COVID-19 have been counted.
As in other countries, the case fatality rate in Australia at older ages is, as expected, significantly higher than the average case fatality rate. The graph shows the case fatality rate for each age band and gender, and also spilt between the first wave (cases and deaths at 31 May) and the second wave (cases and deaths after 1 June). The overall case fatality rate for wave 1 is 1.5% and for wave 2 is 3.9%.
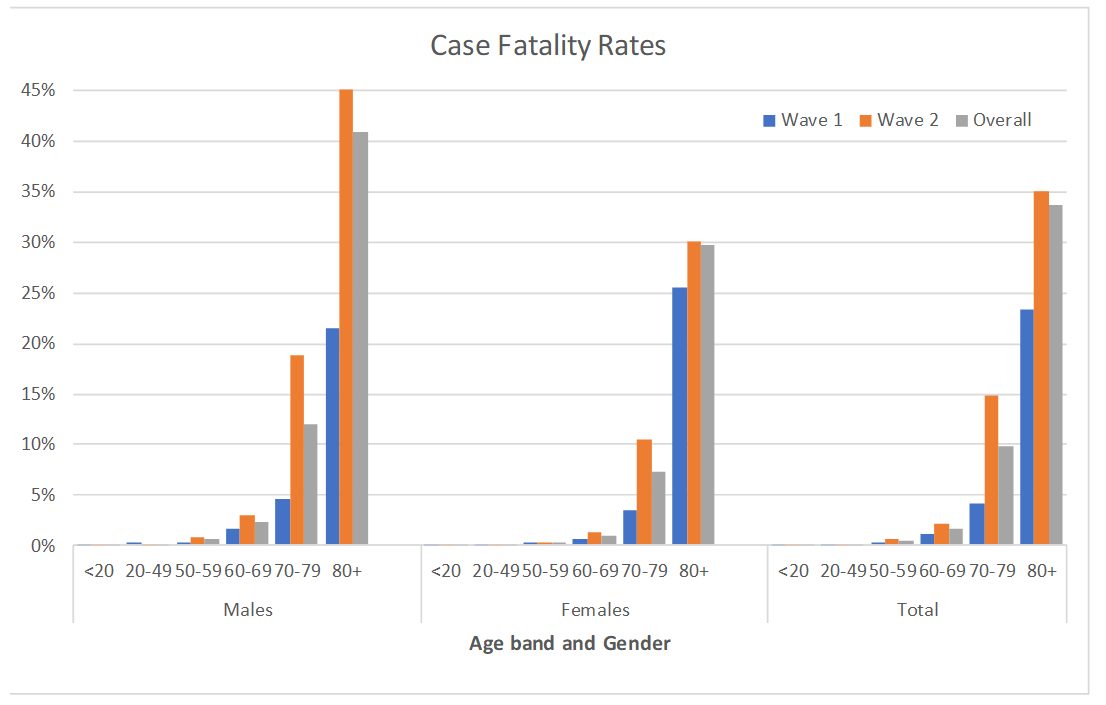
There have been no reported deaths in Australia from COVID-19 in any males under the age of 20 or females under the age of 50. At all ages, the case fatality rate for males is higher than that of females, as is the case for mortality from most causes.
The case fatality rate at older ages was much higher in second wave compared with the first wave for both males and females, reflecting the high proportion of infections and deaths of those in aged care in the second wave.
Risk of being infected with COVID-19
In looking at the deaths from COVID-19 in Australia, it is important to note that different age groups have different risk of diagnosis. The graph shows the proportion of the population diagnosed with COVID-19 in Victoria and in the rest of Australia.[v] It shows that the risk of being diagnosed with COVID-19 in Australia to date is highest for those aged over 90 in Victoria (where the second wave of COVID-19 overwhelms the data from the first wave), with those over 80 also at high risk. This reflects the much higher risk of infection from COVID-19 in aged care than the general population.
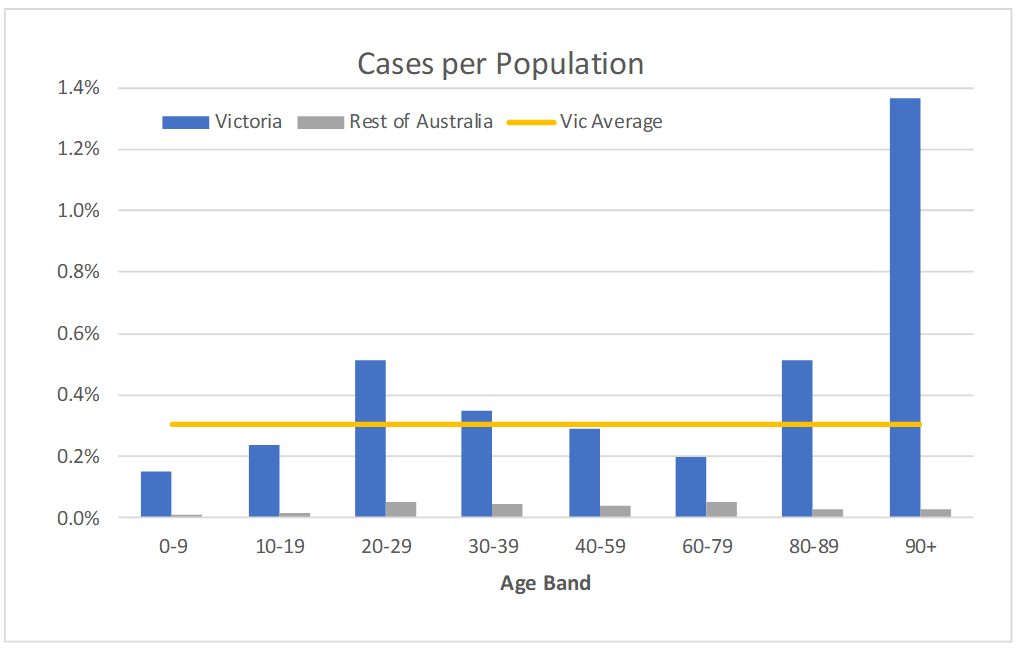
Overall, around 0.3% of Victoria’s population has been diagnosed with COVID-19, around 8 times the rate of the rest of Australia at 0.04%.
There have been significantly fewer people diagnosed in the 0-19 age bands (which has been consistent world-wide, because younger people seem to be both less likely to contract the virus and more likely to be asymptomatic when they do COVID-19) and the 60-79 age bands (presumably as most people in these age groups do not need to work and have been able to largely stay away from other people). There have been significantly more people diagnosed in the 20-29 age band which may be due to the nature of work of younger people (less able to do from home, more public facing roles, in some cases multiple workplaces) and the household structures of this cohort (more likely to live with other adults rather than children).
For context, we note that 0.6% of the world’s population has been identified as infected. The infection rate is significantly higher in the USA (2.9%), the UK (1.7%) and Europe overall (1.5%), and each of these is almost certainly missing substantial unidentified cases, given how high the positivity rate has been in these countries.[vi]
Comorbidities
The ABS has reported on identified COVID-19 deaths up to 31 August. According to death certificates, 682 deaths were identified as caused by COVID-19 by 31 August, with a further 18 deaths where COVID-19 was not the underlying cause, but the person who died had tested positive. By comparison, using the daily tolls reported in the media, 652 deaths had been reported by 31 August. Some of this difference is likely due to timing, as there were 50 COVID-19 deaths reported on 4 September as having occurred in July and August.
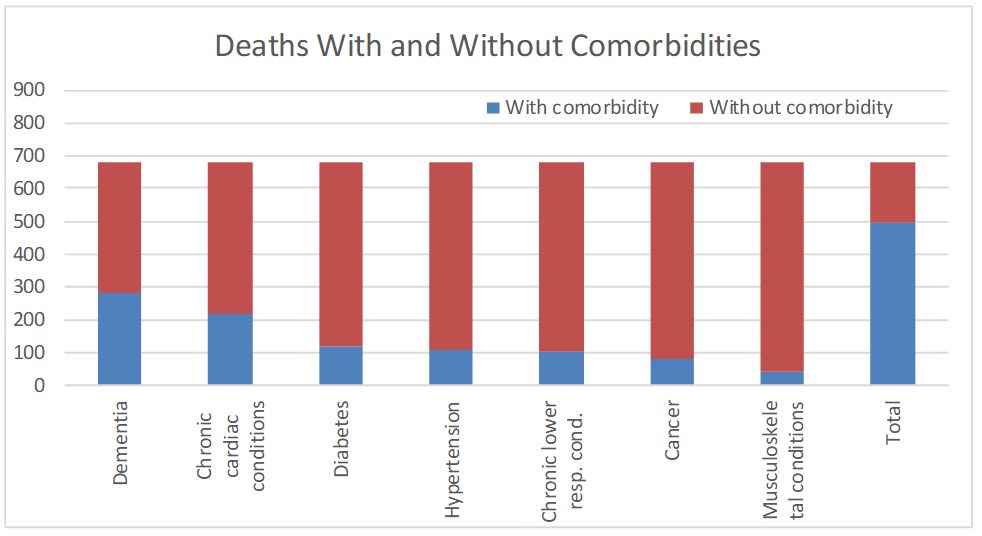
The ABS report includes a summary of comorbidities certified with COVID-19 deaths. This is defined as certified chronic conditions identified on the death certificate of a person who dies of COVID-19, noting that people can have multiple comorbidities. Of the 682 COVID-19 deaths to the end of August, 186 (27%) had no pre-existing conditions while 496 (73%) had at least one pre-existing condition. The most common pre-existing condition was dementia, which was present in 282 COVID-19 deaths.
We are very fortunate in Australia that deaths from COVID-19 are low enough that it is difficult to draw conclusions about whether (or to what extent) any particular comorbidity contributes to COVID-19 deaths. In the UK, however, where more than 45,000 people have so far died of COVID-19, a comprehensive study using NHS data, which includes more than 10,000 of those deaths, looks at which comorbidities appear to lead to worse outcomes from COVID-19.
The UK study looks at whether any particular comorbidity (for example cancer) adds to the risk of death from COVID-19 compared with someone in the population with all other factors the same (for example, age and sex) but without that comorbidity. This qualification is important, as it ensures that the impact of that comorbidity is isolated and not confused with other factors that affect the risk of dying from COVID-19.
Most of the key comorbidities identified in the ABS report are included in this UK study. This table (below) shows the relative risk from each of those. Most comorbidities increase the risk of COVID-19 (in some cases more than doubling it). The impacts shown in the table range from dementia, where the risk of death from COVID-19 doubles, to hypertension (high blood pressure) where the risk of death actually reduces slightly.
Apart from dementia, the riskiest disease is diabetes, particularly diabetes that is not well controlled. This increases the risk of death from COVID-19 to almost double the risk for someone with all the same factors except for the disease.
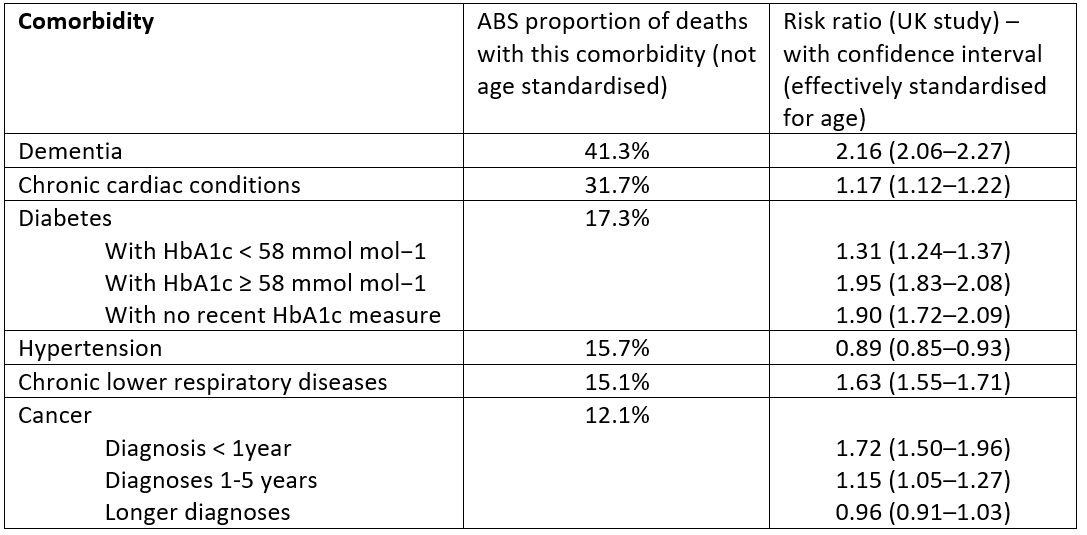
These results should be interpreted with care. For example, the risk factor for dementia is likely to be closely associated with the treatment of COVID-19 patients in aged care. In the UK, as we understand it, in most cases patients in aged care with COVID-19 were not admitted to hospital, which may have led to higher mortality rates for those patients.
To the extent that it can be ascertained given the much smaller number of deaths, the risk associated with comorbidities in Australia appears consistent with this large UK study.
Lifeline is a national charity providing all Australians experiencing a personal crisis with access to 24 hour crisis support and suicide prevention services. Call 13 11 14 for confidential support.
[i] As with our previous analysis, we built a model predicting weekly deaths in 2020, based on the information provided by the ABS about weekly deaths during 2015-2019. For each cause of death:
- we start with weekly deaths from 2015-2019;
- we scale those deaths for population (an 8% increase over five years), age distribution (a 4% increase over five years) and late-reported deaths; and
- we fit a model to predict deaths in 2020, incorporating allowance for average mortality improvement over the last five years (a 3.5% decrease).
[ii] These figures differ from media reports at the time but come from discussion with the ABS in relation to data that is expected to be released later this month. We have been advised that these are the numbers of COVID-19 deaths included in the provisional weekly doctor-certified deaths figures. Any differences to the numbers included in media reports will be solely due to timing differences.
[iii] NSW Health, NSW Suicide Monitoring System, Report 1, October 2020
[iv] Calculated using data from Australian Government Department of Health website. https://www.health.gov.au/news/health-alerts/novel-coronavirus-2019-ncov-health-alert/coronavirus-covid-19-current-situation-and-case-numbers#tests-conducted-and-results
[v] Calculated using data from the websites of the Australian Government Department of Health and the Victorian Department of Health and Human Services. Population data has been sourced from ABS publications
[vi] Our World in Data as at 6 November
CPD: Actuaries Institute Members can claim two CPD points for every hour of reading articles on Actuaries Digital.


