Olympic gymnastics – underperformers or statistical quirk?
In this edition of Normal Deviance, Hugh runs the numbers over apparent underperformance in the Olympics gymnastics events.
Like many others experiencing lockdowns in recent times, I have been enjoying the Olympics immensely. Sport at the highest level is always compelling, and I have also adopted the Australian tradition of pretending to be an expert in sports that I only watch once every four years. One of these sports is artistic gymnastics. The level of skill is truly remarkable, particularly compared to someone like me who cannot even cartwheel.
If you did watch the all-around finals, you may have heard one regular refrain from the commentators: “that score’s down on their qualifying heat, too”. The implication was that for some reason (pressure, fatigue, or something else) the top gymnasts were underperforming relative to their potential and what they’d demonstrated in the qualification stage.
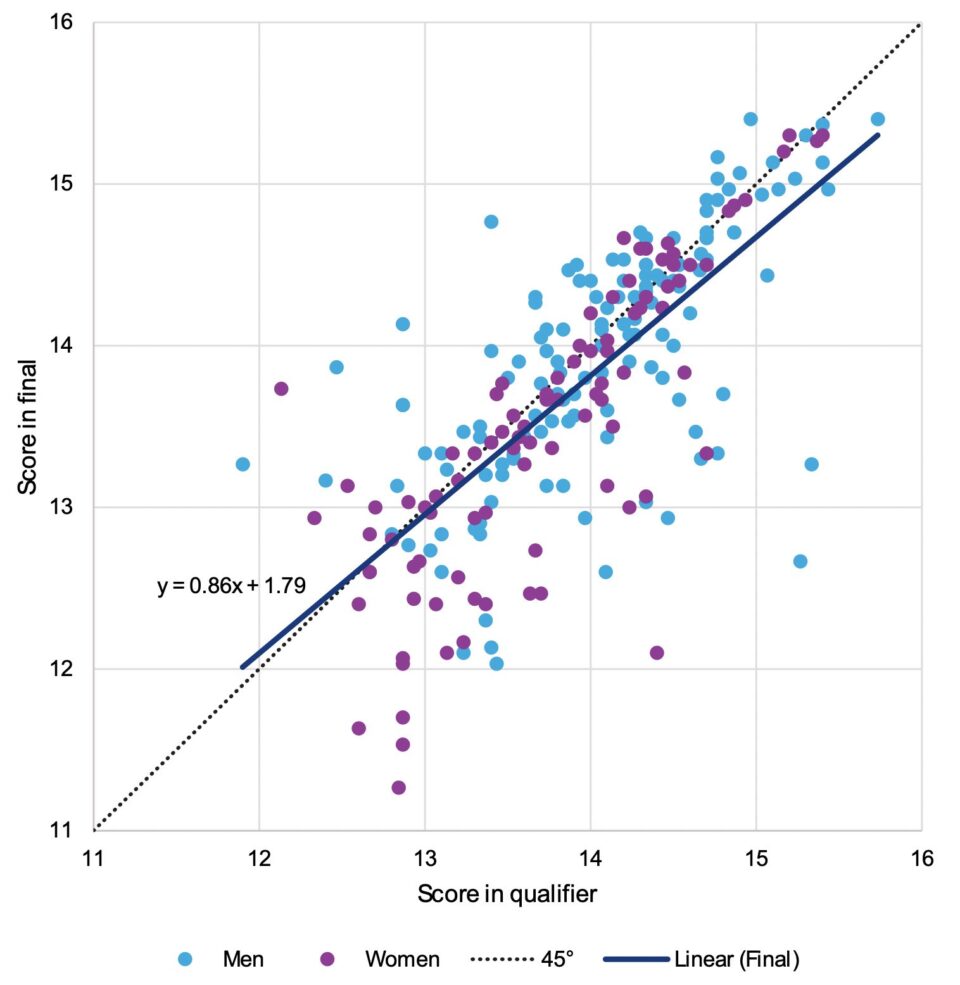
But is this right? To test, I have taken the qualifying and final scores for each individual apparatus for all the individuals in the all-around final, for both men and women. The dataset is summarised in the figure below, along with a line of best fit.

At first glance, the theory appears to hold true; the line of best fit, shown on the figure, has a slope less than one (0.859 ± 0.085, using a 90% confidence interval) which implies that at the top end, the expected score for the final was slightly below the qualifying score. For example, the ‘best’ prediction for someone who scores an (excellent) 15.0 in qualifying is a score of 14.7 in the final.
However, those paying attention will recognise the pattern is a classic case of reversion to the mean. This occurs when there is some randomness in both the x-variable (here qualification score) and the y-variable (final score). In such circumstances, those who have an unusually high score in qualifying are more likely to see a downwards reversion in the next observation. One way to see the effect is to flip the regression around; if we try to estimate the qualifying score as a function of the final round score, we again see a regression slope lower than one (0.638 ± 0.063). We cannot conclude that those people underperformed in the final (relative to qualifying) and also underperformed in qualifying (relative to their finals score)! It must be a regression to the mean effect.
The effect is also heightened in the downward direction since only higher scores are taken through to the final. Therefore, we can only see the top end of the curve, where there are more likely to be downward divisions.

While slightly less exciting for the commentators, the reality is that maintaining scores from qualifying across to finals is a challenge – the statistics will point in the other direction. But with a correlation of 0.74, we also see that there is also a lot of stability in the results too – those right at the top tend to still do well in the final.
While we have got the data, we may as well do some more hypothesis testing and investigation:
- The regression slope is higher for women than men, in a statistically significant way. I’ve not gone back to previous events to see whether this pattern repeats but is suggestive of better consistency for the women this Olympics.
- The regression slope is lowest for men’s pommel horse, in a statistically significant way. Again, this may not hold up over previous events, but if you watched the all-around final, you would have seen a fair amount of carnage on the pommel, as people struggled to reproduce winning routines.
- One other feature is of the data is the left skew in residuals – people are much more likely to have a large negative aberration than a large positive one. Not surprising, given the nature of the sport, but it does mean we could be a bit more nuanced with our assumed error distributions.
We might not get a stage where gymnastics commentators incorporate the statistical quirks of repeated experiments under randomness. But for those aware of them, we can have even more respect for those elite athletes who manage to consistently produce top scores.
CPD: Actuaries Institute Members can claim two CPD points for every hour of reading articles on Actuaries Digital.


