Third highest Australian Actuaries Climate Index reflects soaked spring
The Australian Actuaries Climate Index has been updated for Spring 2022, with the results showing extreme weather conditions that have led to continued flooding in the southeast.
The index measures the frequency of extreme weather conditions and sea levels across Australia and how these vary over time.
It covers extreme high and low temperatures, extreme rainfall, consecutive dry days, extreme wind and sea level. The index was launched in November 2018 by the Actuaries Institute and is updated four times a year by Finity Consulting.
Unlike many other measures, the climate index focuses on changes in the extremes. This is a more relevant metric for the insurance industry than averages, as it correlates more closely with damage. This is done by measuring how often we observe exceedances of the 99th percentile of the reference period of 1981-2010. More details and full results can be found on the microsite.
The purpose of the climate index is to provide a publicly available measure of extreme weather and demonstrate how the capabilities of the actuarial profession can contribute to the assessment of climate risk. Alongside the North American Actuaries Climate Index[1], it is one of two climate indices produced globally on behalf of actuarial associations and has been referenced in the media[2] and in government reports[3].
In the spring of 2022, the third-highest overall index value ever was recorded. This composite index is an average of the extreme high-temperature index, extreme rainfall index and sea level index.
Extreme rainfall persists
Spring brought the second-highest extreme rainfall value for Australia as a whole.
This was primarily driven by the Central Slopes cluster (which covers inland parts of New South Wales and Queensland), and the Southern Slopes (Tasmania) cluster. Both recorded the highest-ever extreme rainfall index value. Other clusters in southern parts of the country recorded the second-highest extreme index value.
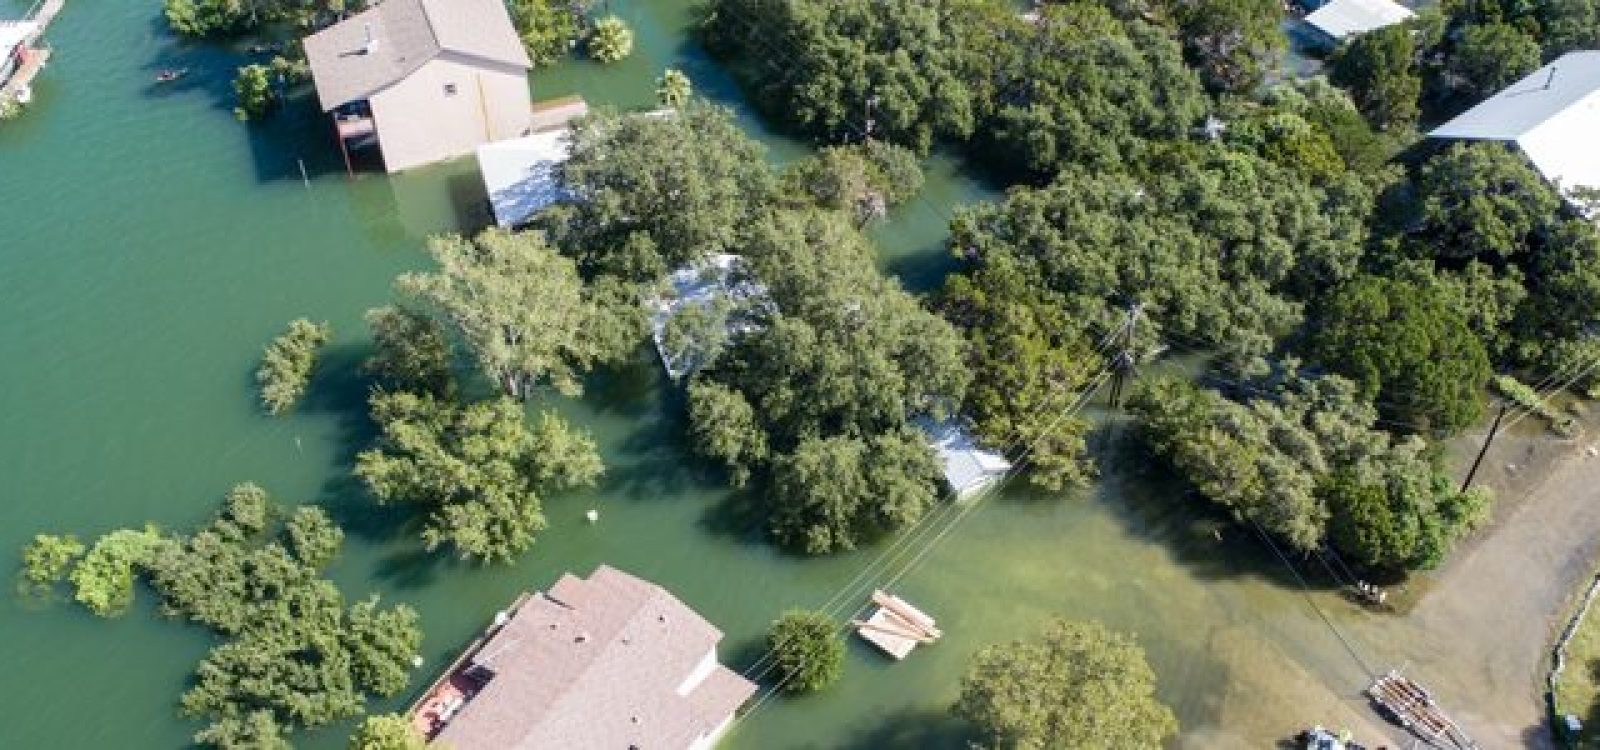
On the ground, this was seen as a continuation of the flooding that has affected Australia for over a year. The most recent mid-October storms and floods in New South Wales, Victoria and Tasmania resulted in estimated insured losses of $477 million as of the end of November. This follows on from $250 million of claims arising from the flooding in western Sydney in July and $5.65 billion due to flooding in February and March. According to the Insurance Council of Australia, one in 25 Australians has made a flood or storm-related claim since January 2020[4].
In Tasmania, where a record extreme rainfall index value was observed, water volumes in Lake Sorell increased by over 13,000 megalitres between the 12th and 14th of October. This is sufficient to supply the entire state’s households with water for almost 5 months.
These extreme conditions have been influenced by multiple climate systems that have all been in phases that contribute to higher levels of rainfall this spring[5]. The third La Niña event to affect Australia since 2020 began at the end of August, increasing rainfall over much of the country. In addition, a negative Indian Ocean Dipole was underway from August to December, which likely contributed to heavy rainfall in the southern parts of the country. Finally, a positive Southern Annular Mode lead to higher rainfall in the southeast.
Moderate temperatures seen everywhere but North Eastern Queensland
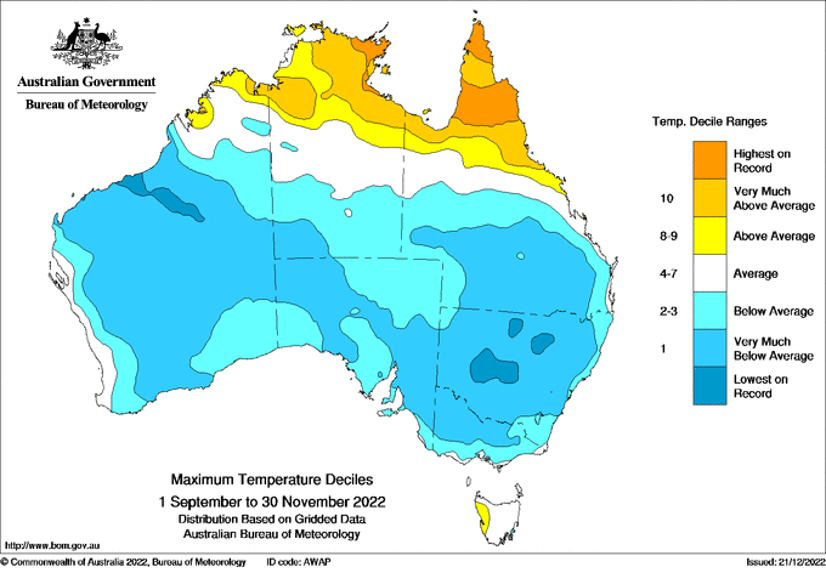
The extreme high-temperature index was negative for most of Australia, indicating that the frequency of extreme high temperatures was below the reference period average. Several clusters observed the second or third-lowest index value ever.
However, one exception to this was the Wet Tropics cluster, which covers the most northeastern parts of Queensland and recorded the highest-ever extreme high-temperature index value.
These strong geographical differences in high temperatures were also observed by the Bureau of Meteorology, who recorded cooler temperatures for the lower half of the state and record high mean temperatures in the tropical north, as shown in the map below[6].

High sea levels in south-east
The sea level index was the third highest for the country as a whole. This was predominantly due the Southern Slopes (Victoria) cluster, which covers the coast of Victoria and a small section of southern New South Wales. The rest of the East Coast and Tasmania also showed high sea level values.
The Intergovernmental Panel on Climate Change has found that sea level rise in Australasia has been higher than global averages in recent decades[7]. Sea level rise is predominantly due to thermal expansion of the oceans and the melting of land-based ice. This contributes to coastal erosion and coastal inundation.
What can we expect next?
The El-Niño Southern Oscillation weather system remains in a La Niña phase in the summer of 2022/23, but this is predicted to return to neutral in February 2023. Similarly, the Southern Annular Mode is strongly positive. Both of these weather systems continue to produce above-average rainfall in many parts of the country.
The Bureau of Meteorology has predicted that Australia will remain in a neutral ENSO phase until June, at which point it will enter a drier, hotter El Niño period[8].
These naturally occurring cycles sit upon the backdrop of a changing climate. Australia’s climate has warmed by approximately 1.47 degrees since 1910, which leads to a higher frequency of heatwaves and bushfires. High-intensity rainfall events have also become more common[9]. While the climate cycles are likely to turn soon, the trend towards more extreme weather is set to continue.
The Actuaries Institute Australia is also investigating possible ways of improving the climate index. This includes monitoring the updates made to the North American Climate Index and the development of the Climate Risk Index[10]that is being developed to link the weather components of the climate index to damages to property and life.
The full results of the Australian Actuaries Climate Index and methodology details are available here.
References
[1] https://actuariesclimateindex.org/home/
[2] https://www.insurancebusinessmag.com/au/news/environmental/climate-index-reaches-record-levels-414880.aspx
[3] https://naturaldisaster.royalcommission.gov.au/publications/exhibit-1-006003-shp5010010001-australian-actuaries-climate-index-some-comments-extremes
[4] https://www.insurancebusinessmag.com/au/news/natural-catastrophe/insurers-have-a-12-billion-storm-and-flood-damage-bill-429015.aspx#:~:text=The%20ICA%20said%20July%27s%20severe,cost%20of%20nearly%20%24250%20million.
[5] http://www.bom.gov.au/climate/model-summary/#tabs=Overview
[6] http://www.bom.gov.au/climate/current/season/qld/summary.shtml
[7]https://www.ipcc.ch/report/ar6/wg1/downloads/factsheets/IPCC_AR6_WGI_Regional_Fact_Sheet_Australasia.pdf
[8] http://www.bom.gov.au/climate/model-summary/#tabs=Bureau-model®ion=NINO34
[9] http://www.bom.gov.au/climate/outlooks/#/overview/influences
[10] https://www.actuary.org/sites/default/files/2020-01/ACRI.pdf
CPD: Actuaries Institute Members can claim two CPD points for every hour of reading articles on Actuaries Digital.


