Negative Auto-correlations with Share Investments
Does your superannuation or wealth management projection model allow for negative auto-correlations of share investment performance?
This is the first of three articles by Colin Grenfell and Cary Helenius about these correlations. This article focuses on demonstrating the consistent presence of negative auto-correlations across the historical data, and the second article will illustrate some of the ramifications for simulation models and related business decisions.
Auto-correlation (or self-correlation or serial correlation) refers to the degree of correlation of the same variables between two or more successive time intervals. It measures how the lagged version of the value of a variable is related to the original version of it in a time series. Note that in both articles we only refer to the auto-correlation of investment forces (i.e., the log of 1 + r, where r is the rate of return).
At the International Congress of Actuaries (ICA) 2023 in Sydney, author Colin Grenfell presented a wealth management video with a link to an 88-page supporting Paper. The following analysis is based on Section 15.2 of that Paper but has been updated to reflect investment performance to September 2023 rather than to 30 June 2022.
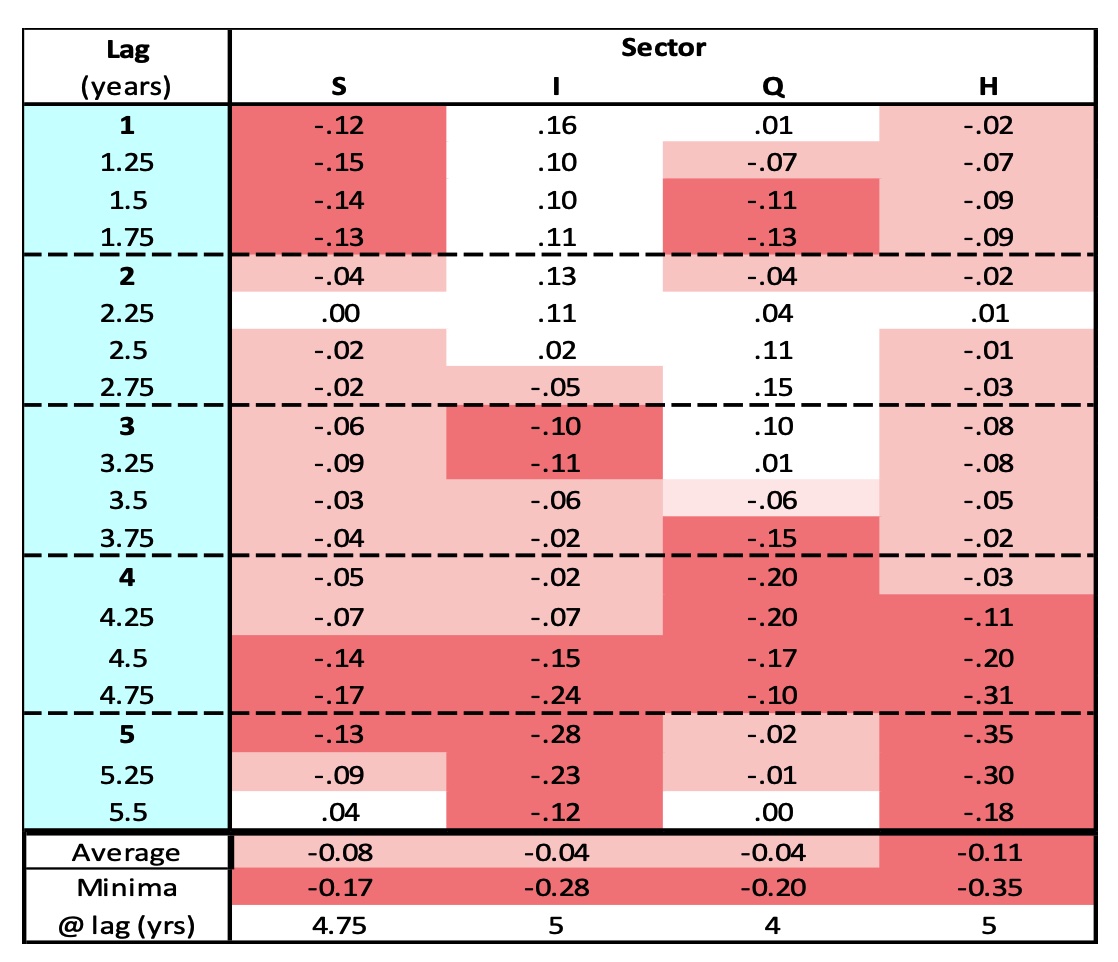
Table 1 below includes 46-year auto-correlations for the four “equity” sectors, for lags of one year to 5.5 years:
(a) Australian shares (the S sector)
(b) International shares, unhedged (the I sector)
(c) Australian property trusts (the Q sector)
(d) International shares, hedged (the H sector)
Negative auto-correlations are shaded in pink – light pink for correlations greater than -0.10 and darker pink for correlations less than -0.10. Negative auto-correlations indicate that there is a tendency for market prices to “bounce back” after falls and/or to “drop again” after price increases. This tendency is somewhat similar, but different, to mean reversion. The S sector negative correlations are more significant than those for the I, Q and H sectors because the S sector negatives are more evident at the important shorter lags.
The negative auto-correlation is very evident for most lags up until about 5.5 years. For lags beyond 5.5 years many of the auto-correlations are positive.
Table 1 “Equity” sector auto-correlations over 46 years

The average auto-correlations (for the 19 lags from 1 year to 5.5 years) are all small but, for all four sectors, they are negative. Also, each of the four sectors has at least six lags with auto-correlations less than -0.10, and 79% of the total observations are negative.
The Australian shares medium to long-term estimate assumptions suggested in Section 16.1 of Colin’s ICA2023 Paper were based on 40-year running average trend results ending in 2024.
For lags of 1 to 5 years, the auto-correlation assumptions are:
- Lag 1 year -.16
- Lag 2 years .00
- Lag 3 years -.12
- Lag 4 years -.05
- Lag 5 years -.18
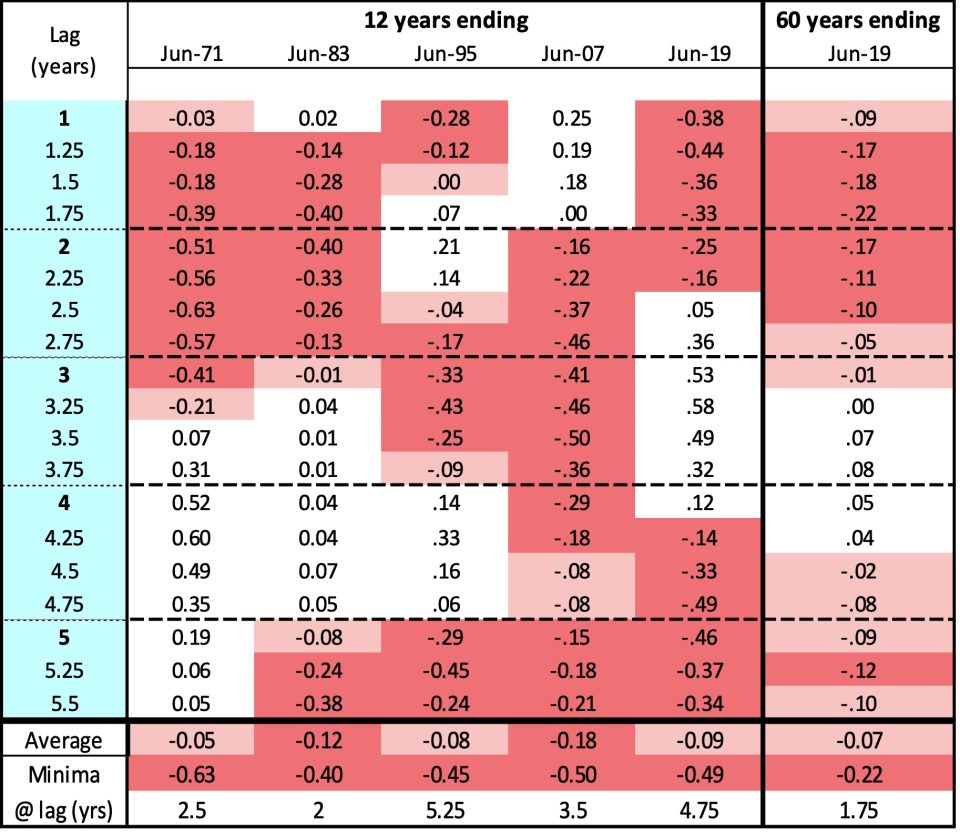
A key consideration is whether auto-correlations are stable or fluctuating over time; to judge this requires a lot of data. For each of 15 sectors, the Austmod historical investment performance database now contains over 64 years of annual forces at quarterly intervals. Thus, there are 256 data-points dating from the years ending 30 June 1960 to 30 September 2023. By considering five non-overlapping 12-year periods, Table 2 below is derived from the latest 240 data-points:
Table 2: Austn. Share Auto-correlations

To get a better understanding of the results, the following charts are based on the six periods included in Table 2 above. The red box in the bottom left-hand corner of each chart shows the area of statistical significance for negative auto-correlations being present, and each of the charts contains some presence of statistically significant negative auto-correlations within the first three and a half years:
Austn. Share Auto-correlations


Because of fluctuating Australian share returns and the short 12-year periods, the shapes for the five periods differ. The analyses in Sections 15.5 to 15.12 of Colin’s ICA2023 Paper show that more consistent shapes would be obtained if periods longer than say 25 years were charted.
However, the average auto-correlations (for the 19 lags from 1 year to 5.5 years) for all periods are again negative. Also, each of the six periods in Table 2 has at least six lags with auto-correlations less than -0.10, and 72% of the total observations are negative.
The chart for the longer 60-year period is a form of an average of the five charts above. Hence, recognising that it has a different scale for the Y axis, it shows a much flatter curve:
Austn. Share Auto-correlations

The results in Table 2 above relate to just one specific set of five non-overlapping 12-year periods. But do they hold for other periods?
To give some insight into this, Table 3 below covers a different set of five non-overlapping 12-year periods. Table 3 below disregards the latest 4 1/4 years of the database, and is derived from the earliest 240 data-points:
The averages and minima from Tables 2 and 3 are very similar.
The average auto-correlations (for the 19 lags from 1 year to 5.5 years) for all periods are again negative. Also, each of the six periods in Table 3 has at least seven lags with auto-correlations less than -0.10, and 65% of the total observations are negative.
Thus, the results hold over all periods in the database, regardless of whether the annual periods are switched from years ending 30 September to years ending 30 June, and so are not dependent on some reoccurring quarterly feature in the year-ending September or the year-ending June data.
Table 3: Austn. Share Auto-correlations

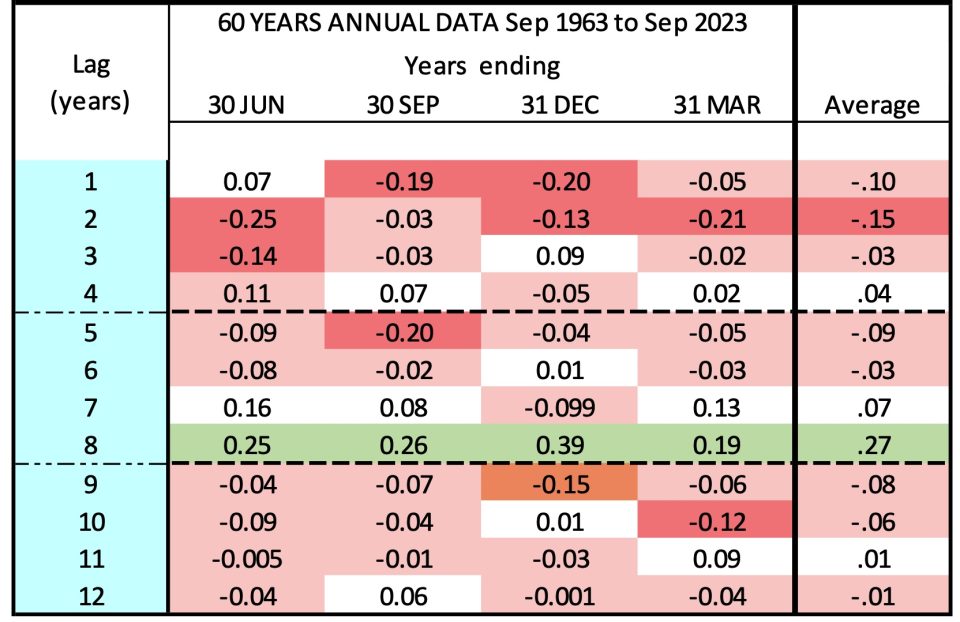
As mentioned above, the Austmod historical investment performance database contains over 64 years of annual forces at rolling quarterly intervals; thus, the annual data is not independent. To show that this does not have a significant impact on the results, Table 4 below is based on four periods at separate annual (rather than quarterly) intervals. These results are therefore independent.
The auto-correlations in the sixth columns of Table 4 are all within .01 of those in the sixth column of Table 2. This shows that the quarterly dependence has an insignificant impact on the results. It is also interesting that each of the first four columns (and the Average column) of Table 4 shows maximum positive auto-correlations at a lag of eight years (shaded in green).
Table 4: Austn. Share Auto-correlations

To get further confirmation that our results were not erroneously impacted by the dependency of the annual data, we examined independent quarterly data and found them to also be consistent with the annual patterns, regardless of the commencing quarter.
The second of our two articles will be published on Monday, 22 January. This article will focus on negative auto-correlations of share investment performance, highlighting the importance and implications for investment modelling, simulations and resultant business decisions of including (or not including) specific assumptions reflecting the observed negative auto-correlations.
CPD: Actuaries Institute Members can claim two CPD points for every hour of reading articles on Actuaries Digital.


