More Negative Investment Auto-correlations
In the last of three articles, authors Colin Grenfell and Cary Helenius illustrate trends in long-term share market investment performance auto-correlations based on data over both 124 and 64 years, highlighting the presence of negative auto-correlations in both datasets.
In this article, we examine whether the negative auto-correlations that strongly featured in 64-year historical data as demonstrated in our previous articles, are also present over the past 124 years of historical share market data.
We also consider the stability of the observed auto-correlation results when measured over different periods, to find the most suitable period for measuring auto-correlations for inclusion in financial modelling assumptions.
Our previous articles on auto-correlations in investment performance focused on various non-overlapping periods. In contrast, this article focuses primarily on auto-correlations over consecutive ‘rolling’ 40-year periods, hence these periods will overlap. However, the use of consecutive periods enables long-term trends to be analysed and brings all available data into scope.
Our first two articles concluded that:
“The presence of the negative share investment auto-correlations for lags under five and a half years does indicate that performance trends in investment markets tend to weaken or reverse over this period.”
The tables in the first article also showed that average auto-correlations for lags 1, 1.25 through to 5.5 years were always negative and ranged from -0.03 to -0.22.
So, do similar observations hold for the extended 124-year historical dataset?
124 Years of Australian Share Market Performance
To further explore whether the negative auto-correlations are simply a feature of the past 64 years or whether they have been a feature of the Australian share market for longer periods of time, we sourced (and updated) a database produced by Marketindex.com.au of 122 years of December year-end Australian share market returns from December 1900 to produce a 124 year database to the end of December 2023.
The data is based on the All Ordinaries accumulation index from 1980 and prior to this date, it used a number of different approaches and sources to compile the database. The data from 1960 to 1980 is highly correlated to the Austmod database over this period (and over the entire 64-year period of the Austmod data) which provides confidence that it is a reasonably produced reflection of the Australian share market.
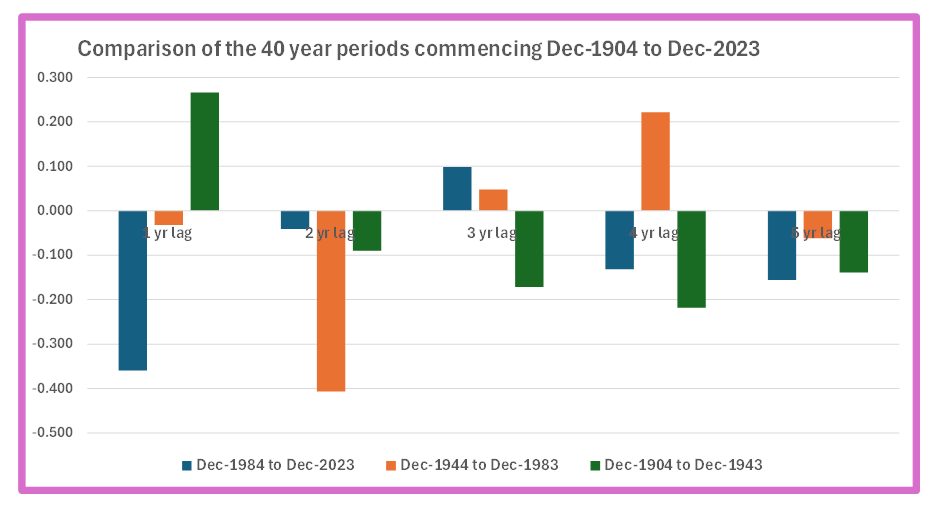
Chart 1 shows how the auto-correlations have varied over the past 120 years across three 40-year time periods 1904-1943, 1944-1983 and 1984-2023. Each of these periods have shown significant negative auto-correlations within the first 5 years of lags, and consistently negative auto-correlations at the 5-year lag.
In the earliest time period, the most significant negative auto-correlation was observed at the 4-year lag, in the middle 40-year period it was observed at the 2-year lag, and in the most recent 40-year period it was observed at the 1-year lag. It does appear there has been a steady trend for the largest negative auto-correlation to be observed at shorter lags over the past 120 years.
The three blocks of time do reflect significant changes and distinct historical periods. The 1904-1943 period included World War 1, the Great Depression and the start of World War 2. The 1944-1983 period included the end of World War 2, strong migration to Australia, and the oil and inflation shocks of the 1970s. The 1984-2023 period included the 1987 stock market crash, tech crash, and a rapid increase in computing and technology, the global financial crisis and COVID-19. All are vastly different periods in terms of the Australian economy and society, and throughout the negative auto-correlations in the share market have been observed.
Chart 1: Auto-correlations for 40-year periods from 1904 to 2023

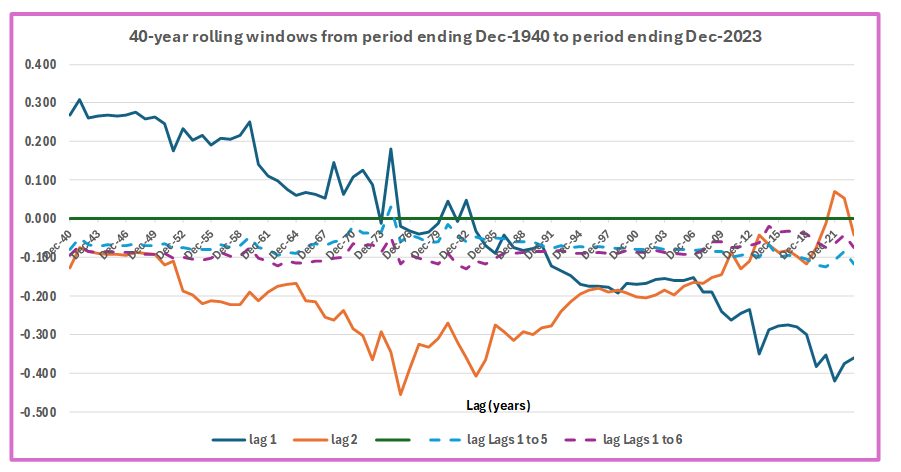
Chart 2 below shows ‘rolling’ 40-year windows for the 1-year and 2-year lags. The choice of 40-year rolling windows is explained later in this article. Chart 2 also shows the average auto-correlations (with dashed lines) for lags 1 to 5 years and for lags 1 to 6 years.
Consistent with Chart 1, the steady downwards trend in the 1-year lag moving from strongly positive to strongly negative, is clearly observed, and likewise, the significance of the 2-year lag being the most negative every year in the 1940-1997 period.
Chart 2: Auto-correlations for rolling 40-year windows from 1900-2023

The auto-correlations for lag 1 year clearly display the trend to a more significant negative value over time. The general downward trend could be reflective of quicker access to global financial news and the introduction and increases in computerised trading on the market.
The average auto-correlations for lags 1 to 6 years are negative for all the rolling 40-year periods. The average auto-correlations for lags 1 to 5 years are negative for all the rolling 40-year periods except the one ending 31 December 1974 (due to the Oil Shock of 1973-74).
However, the message remains clear that over the past 124 years, negative auto-correlations have been an important and significant characteristic of the Australian share market. The consistency of negative auto-correlations for (varying) lags of:
- up to 6 years, across all observed time periods over the past 124 years, and
- for lags of 1 to 5.5 years over the 64 years studied in our first two articles,
suggests that they will continue to feature for Australian shares and should be incorporated within financial modelling.
Incorporating Auto-correlations in Stochastic Modelling
Section 15.8 of Colin Grenfell’s ICA2023 Paper emphasises that auto-correlations are dependent on the period over which they are measured, even if the underlying distribution has been consistent over time.
For example, if annual forces follow (say) an exact 35-year sine-curve over an infinite number of years, then auto-correlations measured over any say 30, 35 or 40-year periods will usually produce different auto-correlations for any given lag.
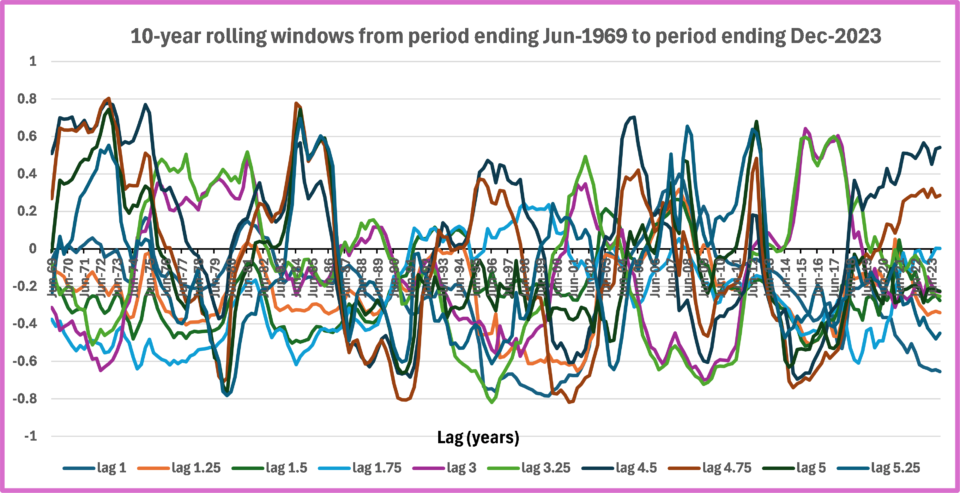
Chart 3, for illustration, shows that if 10-year rolling windows were chosen (i.e., 40 data points per window) the largest observed negative auto-correlations are consistently present for different lags and typically in the -0.6 to -0.8 range across the 64-year period between 1959-2023. While this demonstrates that highly significant negative (and positive) auto-correlations consistently feature in the data across all time periods, the volatility observed in the individual lags is highly variable and difficult to incorporate in financial modelling. It should be noted that the trade-off for the stability preferred for financial modelling assumptions is in the magnitude/variability of the observed auto-correlations.
Chart 3: Auto-correlations for 10-year rolling window from 1959-2023

For determining stochastic projection assumptions in Colin’s Paper, auto-correlations for Australian shares were measured over 40-year periods. There were two key reasons for this:
- 40 years was a convenient maximum period for projections based on working lifetimes, and
- Table 14.2 of Colin’s ICA2023 Paper illustrated the significant stability of ‘rolling’ 40-year auto-correlations for Australian Shares over the entire 63-year period investigated.
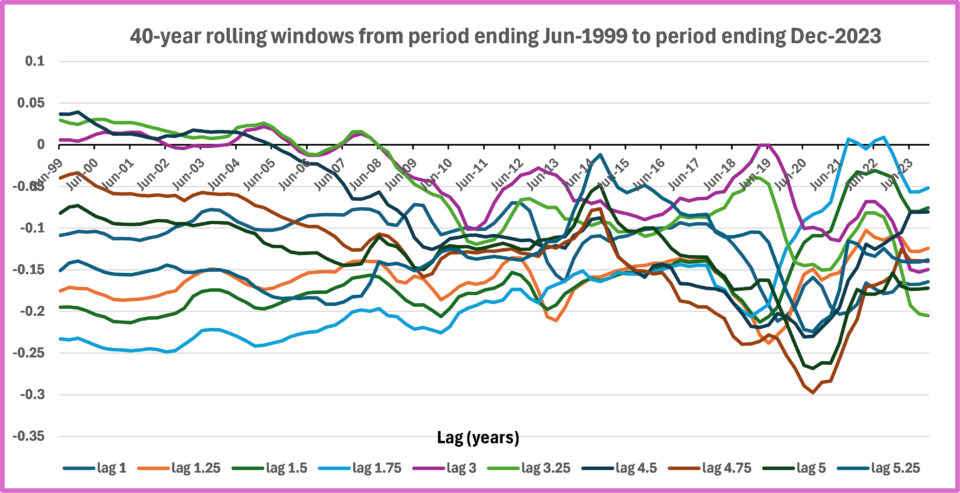
To judge whether 40-year periods remain suitable, we first considered ‘rolling’ 40-year windows at quarterly intervals from 30 June 1999 to 31 December 2023 inclusive. Chart 4 below shows the resultant S sector auto-correlations from the Austmod historical database for lags of 1 year, 1.25 years, 1.5, 1.75, 3, 3.25, 4.5, 4.75, 5 and 5.25 years. These lags were deliberately chosen because they usually exhibited negative auto-correlations. Their correlations had a maximum observed positive value of only 0.04.
Our focus here is on negative auto-correlations, so we have only considered lags less than 5.5 years because our first article showed that “negative auto-correlation is very evident for most lags up until about 5.5 years. For lags beyond 5.5 years many of the auto-correlations are positive.”
Chart 4: Auto-correlations for 40-year rolling windows from 1999-2023

The chosen lags indicate persistent negative auto-correlations over nearly all time periods. Whilst other lags should also be incorporated, the missing lags in Chart 4 had either:
- auto-correlations very close to zero (namely lag 2.75 years), or
- auto-correlations that were usually, or sometimes, positive but fluctuated much more than those in Chart 4 (namely lags 2, 2.25, 2.5, 3.5, 3.75, 4, 4.25 and 5.5 years).
Using all the data from 30 June 1959, we next considered rolling 30-year, 35-year and 45-year periods at quarterly intervals ending 31 December 2023, examining the same lags as in Charts 3 and 4. As expected, the rolling 30-year and 35-year periods produced results that fluctuated more. The average standard deviation of the auto-correlations increased from 5.2% for 40-years to 6.9% and 6.6% respectively for 30-year and 35-year periods. Both the shorter periods also had auto-correlations greater than the 0.04 maximum in Chart 4. The 45-year results fluctuated less but had some auto-correlations greater than the 0.04 maximum in Chart 4.
From this, we concluded that 40-years remained the most suitable period for determining stochastic projection assumptions.
The Australian Shares medium to long-term assumptions suggested in Section 16.1 of Colin’s ICA2023 Paper were based on 40-year running average trend results ending in 2024. We acknowledge that these assumptions should be reviewed over time, but being based on historical trends, they should provide reasonable guidance for input to stochastic modelling.
To conclude, and for completeness, Table 1 below shows the current auto-correlation assumptions for lags up to 10 years being used in the Austmod model:
Table 1: Australian share auto-correlations assumptions

CPD: Actuaries Institute Members can claim two CPD points for every hour of reading articles on Actuaries Digital.


