How Australia Could Have Won Eurovision
In this Normal Deviance column, Hugh passes a statistical eye over the impact of running order at the glitziest of all singing competitions.
I do love Eurovision, and this is not the first time I’ve subjected results to unnecessary statistical analysis. With the 2024 final not far away and Electric Fields narrowly missing out in the semifinal, let’s take the opportunity to look at the dark art of the Eurovision running order.
Audience versus jury votes
Since 2016, the Eurovision result has been decided by the combined sum of an audience vote and a jury vote. It is widely believed that appearing early in the show is disadvantageous, particularly for the audience vote.
A combination of people tuning in late and plus recency bias when voting opens at the end of the performances means that later appearances should do better. The running order is not random, so this is also partly self-reinforcing; favourites are often slotted in middle-to-late in the running order precisely for this reason. Indeed, no song in the first third of the show has won Eurovision since 2003.
That said, as far as I can tell, the effect of running order has never been formally tested. The current twofold scoring system (audience + jury) gives a natural way to test the effect.
If audience scores are consistently below jury scores (which we assume here are less affected by running order) for early performances, then that is credible evidence of an effect.
Data was taken from https://eurovisionworld.com/ from 2016 through to 2023. Data and (brief!) analysis code are available here.
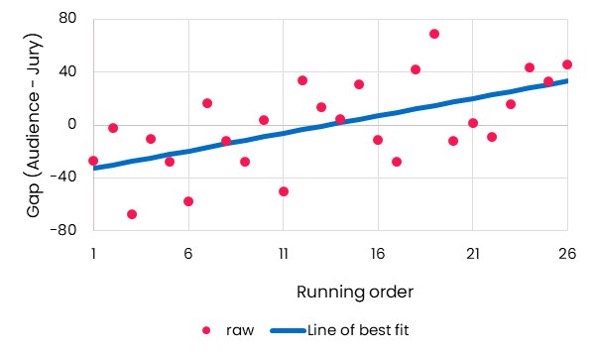
Statistical results are summarised in the figure below. The red dots show the average gap between audience and jury scores. There is clearly a lot of noise (there are many other factors that contribute to gaps), but also a steady drift upwards with run order.
Figure 1 – Impact of running order

The line of best fit is statistically significant (p<0.01) and gives a slope of 2.6 audience votes for every slot later in the running order. This totals to a 66-point gap between the opening act and the last. Given the average winning margin is 76 points over our data time span, this feels fairly material.
With the line of best fit estimate for the impact of running order, we can standardise scores – below we adjust audience scores as if all performers were in the middle of the running order (between slot 13 and 14).
In most cases, the rankings remain relatively stable at the top, but there are some movements.
Shown below is the table from 2022. The results that year were characterised by an overwhelming audience vote for Ukraine due to the war, so some (particularly UK watchers!) regard second place as a partial victory. But Sam Ryder’s Space Man actually finished behind Chanel of Spain after adjustment – the UK was helped significantly by its late position.
Table 1 – Official and adjusted results for 2022 Eurovision results
|
Original Place |
Running order |
Country |
Song & Artist |
Total Score |
Adjusted score |
Adjusted rank |
|
1 |
12 |
Ukraine |
Stefania, Kalush Orchestra |
631 |
634.5 |
1 |
|
2 |
22 |
United Kingdom |
Space Man, Sam Ryder |
466 |
443.0 |
3 |
|
3 |
10 |
Spain |
SloMo, Chanel |
459 |
467.8 |
2 |
|
4 |
20 |
Sweden |
Hold Me Closer, Cornelia Jakobs |
438 |
420.3 |
4 |
|
5 |
24 |
Serbia |
In Corpore Sano, Konstrakta |
312 |
283.7 |
5 |
Other changes in rankings are visible across other years.
In 2017 Italy’s Occidental Karma was expected to do well and underperformed to finish sixth, gorilla suit notwithstanding. However, it did appear relatively early (9th) in the running order and actually moves to fourth after adjustment, leapfrogging Belgium and Sweden which both appeared very late in the run order.
But perhaps most important for Australian fans is the 2016 result, which marked our high point in the Eurovision Song Contest, when Dami Im posted second, only 23 points behind the winner (again Ukraine). Official and adjusted results are shown in Table 2.
Table 2 – Official and adjusted results for 2016 Eurovision results
|
Original Place |
Running order |
Country |
Song & Artist |
Total Score |
Adjusted score |
Adjusted rank |
|
1 |
21 |
Ukraine |
1944, Jamala |
534 |
513.7 |
1 |
|
2 |
13 |
Australia |
Sound of Silence, Dami Im |
511 |
511.8 |
2 |
|
3 |
18 |
Russia |
You Are the Only One, Sergey Lazarev |
491 |
478.6 |
3 |
|
4 |
8 |
Bulgaria |
If Love Was a Crime, Poli Genova |
307 |
321.0 |
4 |
|
5 |
9 |
Sweden |
If I Were Sorry, Frans |
261 |
272.4 |
5 |
After adjustment, Ukraine still pips Australia by two points. However, remember that this adjustment moves all people to the middle of the running order.
The model results actually suggests that if Dami Im had performed after Ukraine in 2016 then Australia would have won. This feels like a fairly significant result – that some fortuitous scheduling could have made all the difference.
Of course, there are lots of limitations to the analysis. Average results do not mean adjustments are accurate for specific instances. Also, it may be the factors that lead to some songs being put early on are also factors that attract a lower audience vote. And a comprehensive analysis could incorporate some of the other patterns commonly observed in Eurovision voting. But, to my mind, the analysis is enough for Australia to claim a moral victory!
Regardless, I hope you all have the chance to break out the popcorn and sequinned hats for the 2024 final.
CPD: Actuaries Institute Members can claim two CPD points for every hour of reading articles on Actuaries Digital.


