Excess Mortality in First Two Months of 2024 Was Nil, Noting the New Baseline
In their latest article, the Mortality Working Group presents their first set of results using the new approach to setting the predicted number of deaths.
|
In Summary
|
A new approach to setting the baseline predicted number of deaths
Annual Baseline
Our previous Actuaries Digital article discussed in some detail the reasoning behind our change in approach to setting the baseline for 2024. We have moved away from answering the question “How has the pandemic affected mortality?” to instead ask “How is current mortality tracking relative to last year?”
More completely, our estimate of excess deaths measures “How does 2024 mortality compare to the expected level based on 2023, after allowing for one year’s mortality improvement?”. Specifically:
- for deaths due to COVID-19, we have adopted age-standardised death rates (SDRs) for 2024 that allow for two waves per annum, with each successive wave resulting in 20% fewer deaths than the previous wave, reflecting the trend that we have seen since borders were re-opened;
- for respiratory causes, we have adopted the 2023 SDRs for 2024, since it seems reasonable not to allow for any year-to-year mortality trend; and
- for all other causes of death, we have adopted the 2023 SDRs plus an allowance for the pre-pandemic rate of mortality improvement to continue into 2024.
Weekly Seasonality
We have assumed weekly seasonality within the year as set out below.
For COVID-19, we note that Australia was mid-wave at the start of 2024. Therefore, we have allowed for the second half of this wave to occur in January/February 2024. Current indications from respiratory surveillance reports of the state Health Departments suggest that the next wave started around mid-May 2024, so we have adopted this timing, with the wave running through to late August. We have then allowed for another half-wave at the end of 2024.
For influenza, we have allowed for a single wave starting in late-May 2024, based on current indications from the Federal Health Department’s respiratory surveillance reports.
For other respiratory diseases (pneumonia, chronic lower respiratory disease and other respiratory) and dementia, we have allowed for seasonality consistent with the smoothed average of 2022 and 2023, noting that deaths from these causes have been reduced by the ongoing use of non-pharmaceutical interventions, with less seasonality evident in pandemic years compared with pre-pandemic experience.
For cancer, we have assumed no seasonality, as there is little evident in the experience.
For all other causes, we have allowed for seasonality consistent with the smoothed average of 2015-2021 and 2023; we excluded 2022 due to the very high excess mortality for this year.
Prediction intervals
For 2024, we have based our prediction intervals on our analysis for the 2023 baseline (i.e. it represents pre-pandemic variance, excluding COVID-19). We have made this decision as:
- for most causes of death, the variance (and hence prediction intervals) will not be impacted by the pandemic;
- for deaths from non-influenza respiratory disease and dementia, where we believe that the pandemic has impacted variance (in particular, it will have reduced the variance around the timing of the winter peak), we only have two years of data on which to base the new level of variance, which is insufficient for this type of analysis; and
- for deaths from COVID-19, the weekly/monthly variance results from both the timing and amplitude of the waves, both of which are very difficult to predict. We think that any estimate of variance for COVID-19 deaths will be little more than a guess.
Therefore, we have maintained the same percentage prediction intervals as for the 2023 baseline for each cause of death and for all causes combined, with some modification to allow for the new seasonality (i.e. the slightly changed timing around the winter peak). As a result, the prediction interval shown in Figure 1 is narrower than the true prediction interval including COVID-19 deaths.
Historical context
Excess mortality was 11% in 2022 and 5% in 2023, both measured relative to pre-pandemic expectations of mortality. In adopting a 2024 baseline based on 2023 mortality (adjusted as discussed above), we note that:
- this baseline will include any temporary pandemic impacts affecting 2023 mortality;
- any such temporary pandemic impacts are impossible to quantify;
- we are assuming that underlying non-COVID-19 mortality will continue to improve, which it had done for decades prior to the pandemic;
- it is increasingly unclear whether – and to what extent – the underlying mortality improvement rate would, by now, be higher or lower than the pre-pandemic trend; and
- therefore, there is more than usual uncertainty around the appropriate baseline for expected mortality and this uncertainty will continue as we move towards “new normal” post-pandemic mortality.
We stress the high uncertainty (and correspondingly wide confidence interval) relating to the resultant calculation of excess mortality.
The new approach to estimating the baseline results is a predicted 184,700 deaths for 2024, including 2,400 deaths from COVID-19. This compares to 183,700 actual deaths in 2023 (including estimated late reports), of which 4,600 were from COVID-19. Predicted numbers of deaths are increasing faster from demographic changes (ageing and population size) than they are reducing due to mortality improvement, even though age-adjusted death rates are reducing. Therefore, our model predicts higher baseline numbers of deaths for 2024 compared with 2023.
Excess deaths to 29 February 2024
Figure 1 shows the results of our analysis, comparing actual deaths each week to our predicted values and the 95% prediction interval. As our baseline measurement for 2024 differs from that for earlier years, the measurement of the excess for earlier years is not comparable to that for 2024. Therefore, we have only shown 2024 on this chart. Note also that, unlike our baselines for previous years, which were based on the absence of a pandemic, the 2024 baseline includes allowance for deaths from COVID-19.
Figure 1 – Weekly actual and predicted deaths – all causes
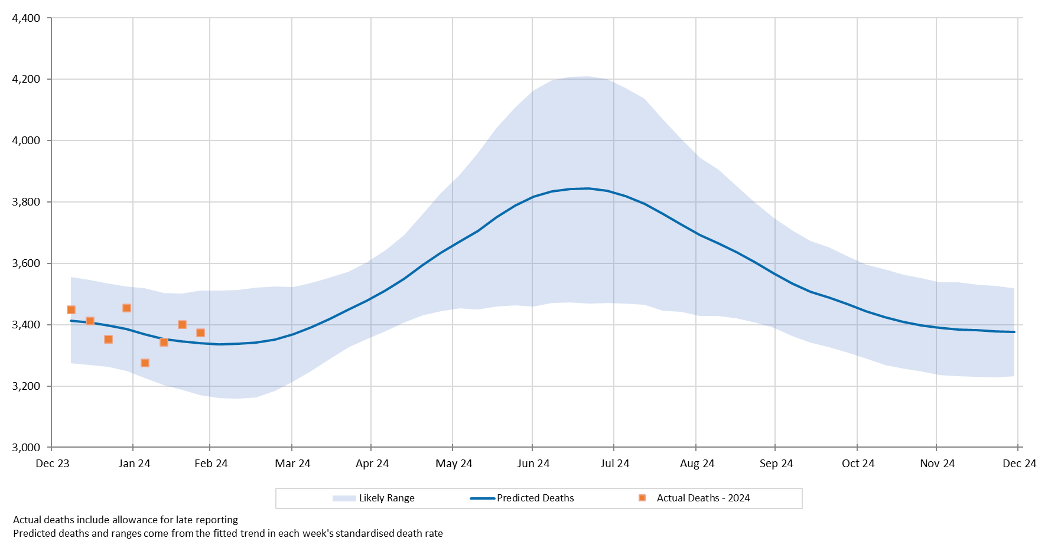
Actual deaths from all causes were close to predicted in each of the first eight weeks of the year.
Figure 2 shows actual deaths from COVID-19 and COVID-19 related deaths from the start of 2022. We have also shown our predicted values for deaths from COVID-19 for 2024.
Figure 2 – Weekly deaths from COVID-19 and COVID-19 related
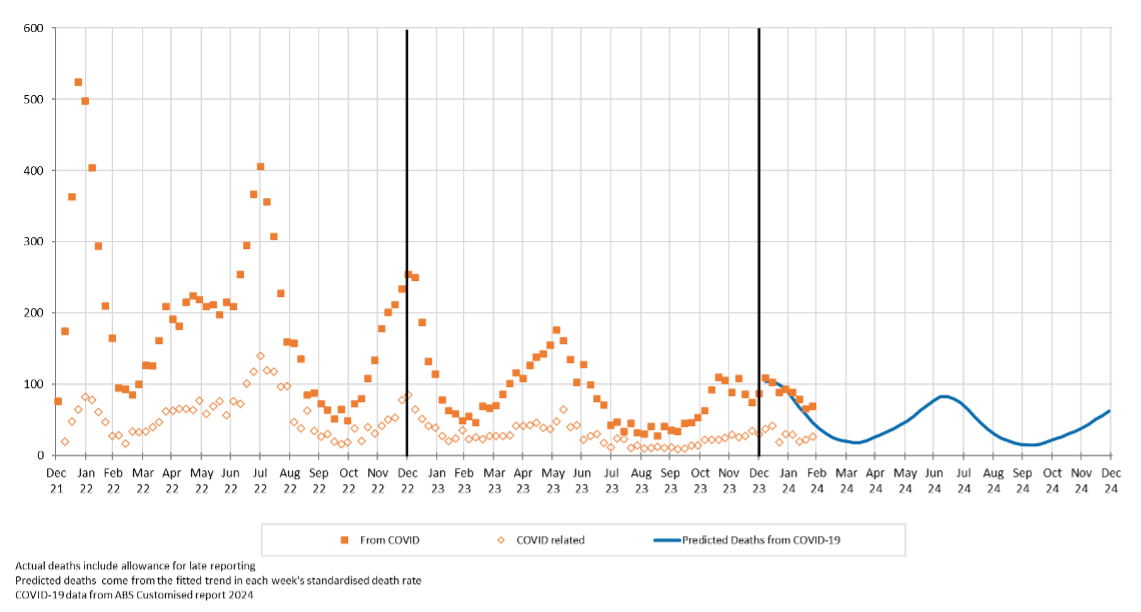
Actual deaths from COVID-19 in the first eight weeks of 2024 have also been close to predicted.
Excess deaths in 2024 by cause of death
Table 1 shows our estimate of excess deaths broken down by cause. [1].
Table 1 – Excess deaths in Australia (v 2023-based expectation)
– by cause of death for 2024

In January and February 2024:
- Total deaths were 100 (0%) less than predicted – i.e., the early experience for 2024 is similar to that of 2023 after allowing for pre-pandemic levels of mortality improvement.
- Deaths from COVID-19 were a little higher than predicted, although the difference is not statistically significant, particularly given the high levels of uncertainty surrounding both the number of deaths from COVID-19 and the timing of COVID-19 waves.
- Deaths from respiratory causes were a little higher than predicted, but only significantly so for influenza. While the numbers involved are small, this is an interesting feature as influenza surveillance showed that prevalence was low. We saw this same feature in the last few months of 2023, suggesting that there could be small numbers of COVID-19 deaths being mis-coded as influenza deaths. This situation could arise when a person dies without having the type of their respiratory infection diagnosed; we think that this is most likely to occur when the death happens at home. While we have noticed possible miscoding of COVID-19 deaths as influenza deaths, this may not be limited to influenza (due to generally lower levels of COVID-19 testing now compared with earlier in the pandemic).
- Deaths from dementia were statistically significantly lower than predicted.
- For all other causes of death, actual deaths in the first two months of the year were as predicted.
Data and terminology
The Mortality Working Group has examined the latest Provisional Mortality Statistics, covering deaths occurring prior 29 February 2024 and registered by 30 April 2024, released by the Australian Bureau of Statistics (ABS) on 31 May 2024.
We have used additional data supplied by the ABS in a customised report in relation to COVID-19 deaths, namely the total number of deaths each week (doctor-certified and coroner-referred) both from COVID-19 and COVID-19 related, defined as:
- deaths from COVID-19 are deaths where COVID-19 is listed as the primary/underlying cause of death; and
- deaths that are COVID-19 related are deaths where the underlying cause of death has been determined as something other than COVID-19, but COVID-19 was a contributing factor mentioned on the death certificate.[2]
Disclaimer
This excess mortality analysis is intended for discussion purposes only and does not constitute consulting advice on which to base decisions. We are not medical professionals, public health specialists or epidemiologists.
To the extent permitted by law, all users of the monthly analysis hereby release and indemnify The Institute of Actuaries of Australia and associated parties from all present and future liabilities that may arise in connection with this monthly analysis, its publication or any communication, discussion or work relating to or derived from the contents of this monthly analysis.
Mortality Working Group
The members of the Working Group are:
- Karen Cutter
- Ronald Lai
- Jennifer Lang
- Han Li
- Richard Lyon
- Matt Ralph
- Michael Seymour
- Amitoze Singh
- Zhan Wang
References
[1] As in our previous work, we have estimated the number of coroner-referred COVID-19 deaths based on the experience of late 2021 and 2022. If our estimate of coroner-referred COVID-19 deaths is too high (or low), this will not affect the total level of excess deaths measured; it will just mean that our estimate of non-COVID-19 coroner-referred deaths will be too low (or high) by the same amount.
[2] The COVID-19 deaths covered in this article are distinct from “incidental COVID-19” deaths, namely deaths where the person was COVID-19 positive at the time of death, but COVID-19 was not recorded on the death certificate. These deaths are generally included in surveillance reporting where identified (other than where there is a clear alternative cause of death, such as trauma) but are not separately identified in the ABS statistics.
CPD: Actuaries Institute Members can claim two CPD points for every hour of reading articles on Actuaries Digital.