Past Extremes are Now Normal
The Australian Actuaries Climate Index (AACI) for autumn of 2024 shows weather which would once have been considered extreme, now seems unremarkable relative to recent years.
The latest AACI shows that the latest season brought weather which was extreme in comparison with the baseline period of 1981-2010, but relatively moderate compared to more recent years.
The composite Index, which aggregates extreme rainfall, high temperature and sea level to provide a view of extreme weather as a whole, was positive in north-western parts of the country, while being close to zero or negative in the south.
This was largely driven by sea level. The Monsoonal North region, which covers most of the northern parts of the country, observed the highest-ever sea level value.
Extreme sea levels in parts of this region have been caused by tropical cyclones, such as Severe Tropical Cyclone Megan[1] and Severe Tropical Cyclone Olga,[2] which formed in March and April, respectively. Tropical cyclones create periods of sustained gale-force winds that push water into the shoreline, elevating sea levels.
In all regions, extreme sea levels will also have been affected by increased sea surface temperatures, which have been elevated for much of the globe for the past year. Warmer ocean temperatures cause the water to expand, thereby contributing to sea level rise.
Other than the highest sea level index value in the Monsoonal North, no records were set in the autumn of 2024. However, we are seeing positive index values in almost every season, indicating that a warming climate is driving up the frequency of readings which are considered extreme today relative to the past.
This is evident in the composite index below, where the dashed line is in line with the most recent index value. During the base period of 1981-2010, this was exceeded 15 times out of 120 seasons, or 12.5% of the time. In the past five years, this value has been breached over 80% of the time.
The above graph shows how seasons that were once considered extreme are now seen as normal or even mild.
Some of the driving forces behind these trends are explained by a recent Report from the Institute and Faculty of Actuaries,[3] which highlights how the probability of extreme events is increasing with climate change. As one example, the report explains how severe floods which previously would have been thought of as unlikely or ‘black swans‘ would now be considered likely.
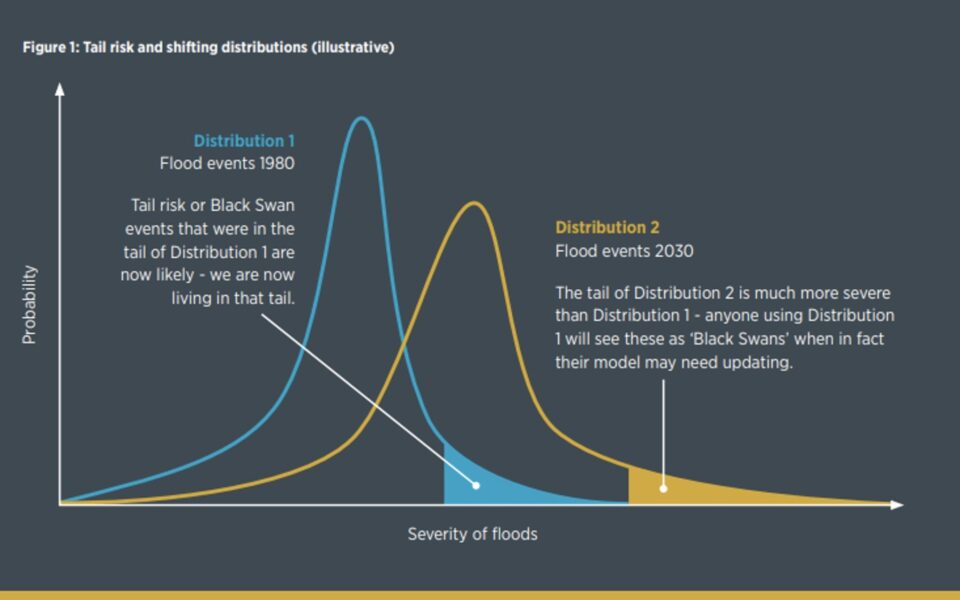
Example probability distributions of the severity of flood events in 1980 and 2023. Data source: Institute and Faculty of Actuaries. (n.d.). Climate scorpion. Retrieved from https://actuaries.org.uk/media/g1qevrfa/climate-scorpion.pdf
This also means that events that have never happened before may now form the new tail of possible extreme events. Critically, this shifting of the distribution is not static and, every year, the “average” event may change.
Looking forward
From August to November, the Bureau of Meteorology has predicted above average rainfall for large parts of eastern and central Australia, and below average for some parts of the north west.
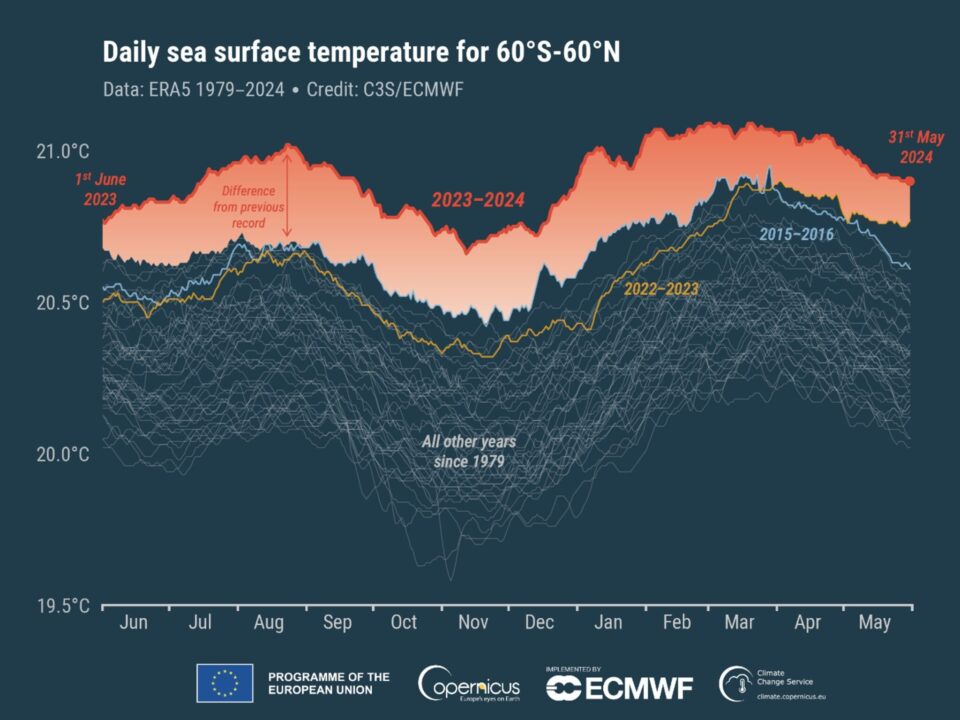
Both minimum and maximum temperatures are projected to be above average for most of the country.[4] This is in keeping with trends seen globally over the past year, which show that June was the 12th consecutive month of global temperatures reaching 1.5 degrees Celsius above pre-industrial averages.[5]
Warmer than average ocean temperatures are contributing to predictions of an active Atlantic hurricane season.[6] The significant concentration of insured assets in this part of the world means that this can have ramifications on the insurance industry more broadly, including on Australian insurers via the reinsurance market.[7]
Background
The Index measures the frequency of extreme weather conditions and sea levels across Australia and how these vary over time. Components cover extreme high and low temperatures, extreme rainfall, consecutive dry days, extreme wind and sea level. The Index was launched in November 2018 by the Actuaries Institute and is updated four times a year by Finity Consulting for the Actuaries Institute.
Unlike many other measures, the AACI focuses on changes in the extremes. This is a more relevant metric for the insurance industry (and others) than averages, as it correlates more closely with damage. This is done by measuring how often we observe the current quarter’s observations exceeding the 99th percentile of the corresponding observations in the reference period of 1981-2010. More details and full results can be found on the microsite.
The purpose of the AACI is to provide a publicly available and objective measure of extreme weather conditions and is one way in which the actuarial profession can contribute to the assessment of climate risk.
Alongside the North American Actuaries Climate Index,[8] it is one of two climate indices produced globally on behalf of actuarial associations and has been referenced extensively in the media and other reports.[9]
References
[1] Bureau of Meteorlogy. (2024). Severe Tropical Cyclone Megan. Australian Government http://www.bom.gov.au/cyclone/history/megan2024.shtml
[2] Bureau of Meteorology. (2024). Severe Tropical Cyclone Olga. Australian Government. http://www.bom.gov.au/cyclone/history/olga2024.shtml
[3] Institute and Faculty of Actuaries. (2024). Climate Scorpion Report. https://actuaries.org.uk/media/g1qevrfa/climate-scorpion.pdf
[4] Bureau of Meteorology. (2024). Climate outlook overview summary. Australian Government. http://www.bom.gov.au/climate/outlooks/#/overview/summary
[5] Copernicus Climate Change Service. (2024). Copernicus June 2024 marks 12th month of global temperature reaching 1.5°C above pre-industrial. https://climate.copernicus.eu/copernicus-june-2024-marks-12th-month-global-temperature-reaching-15degc-above-pre-industrial
[6] National Oceanic and Atmospheric Administration. (2024). NOAA predicts above-normal 2024 Atlantic hurricane season. https://www.noaa.gov/news-release/noaa-predicts-above-normal-2024-atlantic-hurricane-season
[7] Reinsurance News. (2024). An active hurricane season could have profound effects on the re-insurance industry: Moody’s. https://www.reinsurancene.ws/an-active-hurricane-season-could-have-profound-effects-on-the-re-insurance-industry-moodys/
[8] Actuaries Climate Index. (n.d.). Home. https://actuariesclimateindex.org/home/
[9] Royal Commission into National Natural Disaster Arrangements. (2024). Exhibit 1-006003-SHP5010010001: Australian Actuaries Climate Index—Some comments on extremes. https://naturaldisaster.royalcommission.gov.au/publications/exhibit-1-006003-shp5010010001-australian-actuaries-climate-index-some-comments-extremes
CPD: Actuaries Institute Members can claim two CPD points for every hour of reading articles on Actuaries Digital.