Mortality in First Four Months of 2024 in Line with Prediction
In their latest article, the Mortality Working Group shares excess mortality analysis for the first four months of 2024.
|
In summary
|
Excess deaths to 30 April 2024
Figure 1 shows the results of our analysis, comparing actual deaths each week to our predicted values and the 95% prediction interval.
As noted in our Actuaries Digital article in June, for 2024 we have based our prediction intervals on our analysis for the 2023 baseline (i.e., it represents pre-pandemic variance, excluding COVID-19). As a result, the prediction interval shown in Figure 1 is narrower than the true 95% prediction interval including COVID-19 deaths.
As our baseline measurement for 2024 differs from that for earlier years, the measurement of the excess for earlier years is not comparable to that for 2024. Therefore, we have only shown 2024 on this chart.
Note also that, unlike our baselines for previous years, which were based on the absence of a pandemic, the 2024 baseline includes allowance for deaths from COVID-19. This allowance is, given the newness of COVID-19 as a cause of death, a much more approximate estimate than other potential causes of mortality, with the need to estimate both the timing and severity of waves of COVID-19.
Figure 1 – Weekly actual and predicted deaths – all causes
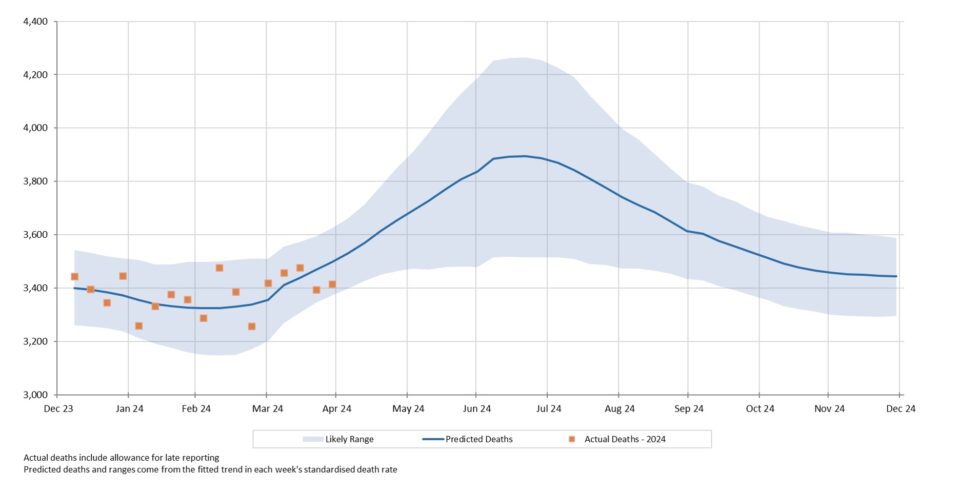
Actual deaths from all causes have been within the 95% prediction interval in each of the first seventeen weeks of the year. Excess mortality increased in March but was lower in April.
Figure 2 shows actual deaths from COVID-19 and COVID-19 related deaths from the start of 2022. We have also shown our predicted values for deaths from COVID-19 for 2024, which were based on the assumption of two waves of COVID-19 per annum, gradually decreasing in size each time.
Figure 2 – Weekly deaths from COVID-19 and COVID-19 related
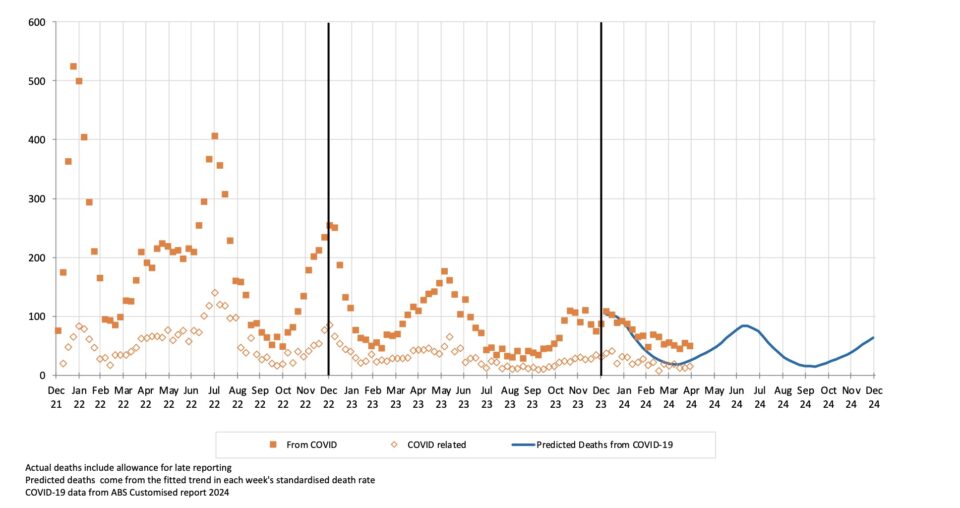
Actual deaths from COVID-19 were higher than predicted during March and April. They were lower than those in January and February, but this reduction has been smaller than predicted. This may indicate that the intra-wave low in the death rate is higher than we anticipated.
It’s also possible that the wave that commenced in late 2023 was flatter than previous ones, with a lower, longer peak and a slower decline. States’ surveillance shows cases increasing from May and peaking in late June, in line with our predicted timing of the next wave. Our next update will show COVID-19 mortality in the first part of the May/June 2024 wave.
Excess deaths in 2024 by cause of death
Table 1 shows our estimate of excess deaths broken down by cause[1].
Table 1 – Excess deaths in Australia (v 2023-based expectation) – by cause of death for Jan-April 2024
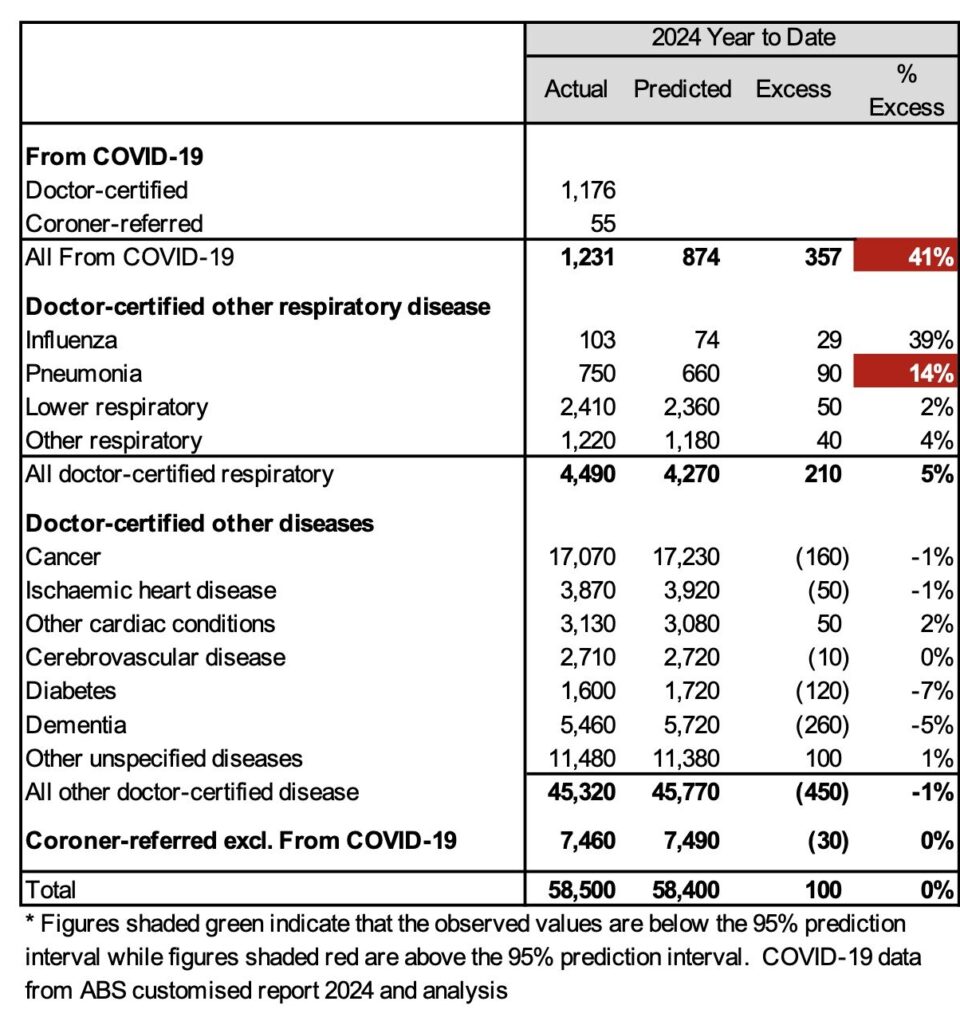
In the first four months of 2024:
- Total deaths were 100 (0%) more than predicted – i.e., the overall experience for the first four months of 2024 is very similar to 2023 after allowing for pre-pandemic levels of mortality improvement.
- Deaths from COVID-19 were significantly[2] higher than predicted. It should be noted that there are high levels of uncertainty surrounding both the number of deaths from COVID-19 and the timing of COVID-19 waves.
- COVID-19 was a much more significant cause of mortality in the first four months of 2024 than influenza (1,231 doctor-certified deaths for COVID-19 versus 103 for influenza).
- Deaths from pneumonia were also significantly higher than predicted.
- Total deaths from non-COVID-19 respiratory causes were 5% higher than predicted, but this is not statistically significant.
- Deaths from all other causes were slightly lower than the prediction, with dementia, cancer and diabetes being the primary drivers of this, although none of these outcomes is statistically significant.
Data and terminology
The Mortality Working Group has examined the latest Provisional Mortality Statistics, covering deaths occurring up to 30 April 2024 and registered by 30 June 2024, released by the Australian Bureau of Statistics (ABS) on 29 July 2024.
We have used additional data supplied by the ABS in a periodical customised report[3] in relation to COVID-19 deaths, namely the total number of deaths each week (doctor-certified and coroner-referred) both from COVID-19 and COVID-19 related, defined as:
- deaths from COVID-19 are deaths where COVID-19 is listed as the primary/underlying cause of death; and
- deaths that are COVID-19 related are deaths where the underlying cause of death has been determined as something other than COVID-19, but COVID-19 was a contributing factor mentioned on the death certificate.[4]
A new approach to setting the baseline predicted number of deaths
Annual Baseline
Our April 2024 Actuaries Digital article discussed in some detail the reasoning behind our change in approach to setting the baseline for 2024. We have moved away from answering the question “How has the pandemic affected mortality?” to instead ask, “How is current mortality tracking relative to last year?”
More completely, our estimate of excess deaths measures how 2024 mortality compares to the expected level based on 2023, after allowing for one year’s mortality improvement. Specifically:
- for deaths due to COVID-19, we have adopted age-standardised death rates (SDRs) for 2024 that allow for two waves per annum, with each successive wave resulting in 20% fewer deaths than the previous wave, reflecting the trend that we have seen since borders were re-opened;
- for respiratory causes, we have adopted the 2023 SDRs for 2024, since it seems reasonable not to allow for any year-to-year mortality trend; and
- for all other causes of death, we have adopted the 2023 SDRs plus an allowance for the pre-pandemic rate of mortality improvement to continue into 2024.
Historical context
Excess mortality was 11% in 2022 and 5% in 2023, both measured relative to pre-pandemic expectations of mortality. In adopting a 2024 baseline based on 2023 mortality (adjusted as discussed above), we note that:
- this baseline will include any temporary pandemic impacts affecting 2023 mortality;
- any such temporary pandemic impacts are impossible to quantify;
- we are assuming that underlying non-COVID-19 mortality will continue to improve, which it had done for decades prior to the pandemic;
- it is increasingly unclear whether – and to what extent – the underlying mortality improvement rate would, by now, be higher or lower than the pre-pandemic trend; and
- therefore, there is more than usual uncertainty around the appropriate baseline for expected mortality and this uncertainty will continue as we move towards “new normal” post-pandemic mortality.
We stress the high uncertainty (and correspondingly wide confidence interval) relating to the resultant calculation of excess mortality.
The new approach to estimating the baseline results in a predicted 186,300 deaths for 2024, including 2,400 deaths from COVID-19. This compares to 183,700 actual deaths in 2023 (including estimated late reports), of which 4,600 were from COVID-19. Predicted numbers of deaths are increasing faster from demographic changes (ageing and population size) than they are reducing due to mortality improvement, even though age-adjusted death rates are reducing. Therefore, our model predicts higher baseline numbers of deaths for 2024 compared with 2023.
Disclaimer
This excess mortality analysis is intended for discussion purposes only and does not constitute consulting advice on which to base decisions. We are not medical professionals, public health specialists or epidemiologists.
To the extent permitted by law, all users of the monthly analysis hereby release and indemnify The Institute of Actuaries of Australia and associated parties from all present and future liabilities that may arise in connection with this monthly analysis, its publication or any communication, discussion or work relating to or derived from the contents of this monthly analysis.
Mortality Working Group
The members of the Working Group are:
- Ronald Lai
- Jennifer Lang
- Richard Lyon
- Matt Ralph
- Michael Seymour
- Amitoze Singh
References
[1] As in our previous work, we have estimated the number of coroner-referred COVID-19 deaths based on the experience of late 2021 and 2022. If our estimate of coroner-referred COVID-19 deaths is too high (or low), this will not affect the total level of excess deaths measured; it will just mean that our estimate of non-COVID-19 coroner-referred deaths will be too low (or high) by the same amount.
[2] While we have not attempted to determine a prediction interval for COVID-19 deaths, we think that this difference must be significant.
[3] The latest such report covered deaths from and related to COVID-19 that were registered by 31 May 2024 (one month prior to the Provisional Mortality Statistics used in this article)
[4] The COVID-19 deaths covered in this article are distinct from “incidental COVID-19” deaths, namely deaths where the person was COVID-19 positive at the time of death, but COVID-19 was not recorded on the death certificate. These deaths are generally included in surveillance reporting where identified (other than where there is a clear alternative cause of death, such as trauma) but are not separately identified in the ABS statistics.
CPD: Actuaries Institute Members can claim two CPD points for every hour of reading articles on Actuaries Digital.