COVID-19 Deaths the Key Driver for 2024 Excess Mortality to November
In their latest article, the Mortality Working Group shares excess mortality analysis for the first 11 months of 2024.
|
In summary
|
We projected mortality for 2024 to include two waves of COVID-19, both lower than 2023, and all other mortality to be an improvement on 2023 (except for respiratory diseases, which we held at the same mortality rates).
While there have been slightly fewer deaths from COVID-19 in 2024 than in 2023, the reduction has not been as great as expected; the difference fully explains the overall excess mortality observed.
Excess mortality in causes other than COVID-19 have largely offset each other. Deaths from other respiratory illnesses (especially influenza) have been worse than expected, whilst cancer deaths have been lower than predicted. All other causes are in line with predictions to date.
Excess deaths to 30 November 2024
We measure excess deaths by comparing actual deaths each week to a baseline. For 2024, this baseline is our predicted values, based on 2023 mortality and expected improvement rates, and including COVID-19. This is different from our baselines for previous years, which were based on the absence of a pandemic. Note that the allowance for COVID-19 is more approximate than other potential causes of death as data on the timing and severity of waves of COVID-19 is still sparse.
Figure 1 – Weekly actual and predicted deaths – all causes
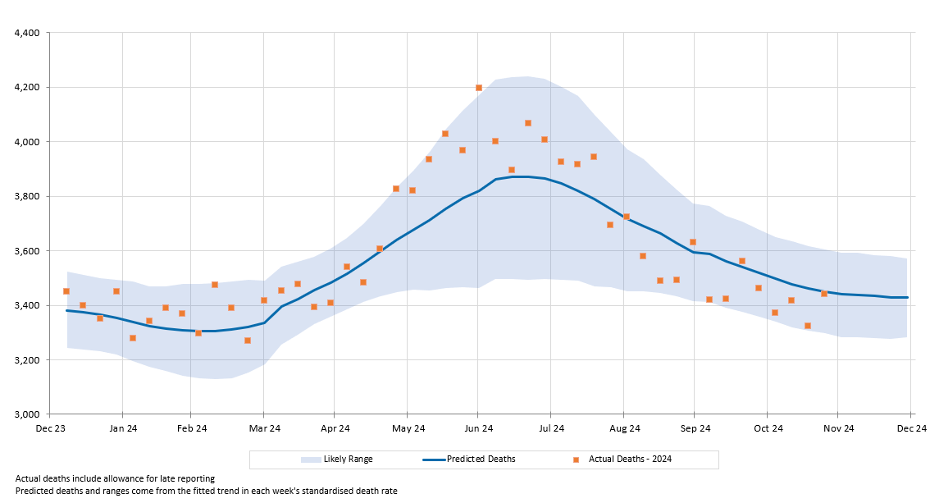
Figure 1 shows the results of our analysis of the experience up to November 2024. We only show 2024 on this chart as the measurement of excess mortality for earlier years is not directly comparable to that for 2024.
We also show our 95% prediction interval. As noted in our Actuaries Digital article in June, for 2024 we have based our prediction intervals on our analysis for the 2023 baseline (i.e., it represents pre-pandemic variance, excluding COVID-19). As a result, the prediction interval shown in Figure 1 is narrower than the true 95% prediction interval including COVID-19 deaths.
In aggregate, mortality has been 1% above the prediction for the first 11 months of 2024, marginally within the 95% confidence interval, while actual weekly deaths have nearly always been within the 95% confidence interval. Weekly deaths generally exceeded the prediction over the winter months, but they have generally been lower than predicted since then.
Figure 2 shows actual deaths from COVID-19 and COVID-19 related deaths from the start of 2022. We have also shown our predicted values for deaths from COVID-19 for 2024, which were based on the assumption of two waves of COVID-19 per annum, gradually decreasing in size each time.
Figure 2 – Weekly deaths from COVID-19 and COVID-19 related deaths
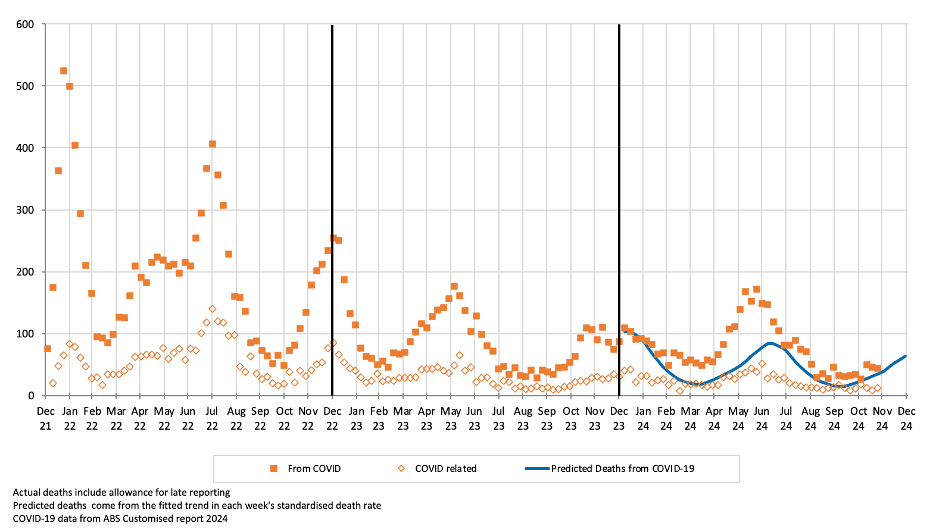
COVID-19 mortality in 2024 has followed the basic pattern that we predicted, albeit with slightly different timing. The wave that hit in late 2023 abated early in the year, and a new wave arrived in the middle of the year before it too abated. However, deaths from COVID-19 have been much higher than predicted over the year.
The mid-2024 wave, which commenced in May, rose more sharply and reached a higher level than we predicted. The peak of that wave was higher than the previous one, contrary to our prediction that peaks would reduce from wave to wave. In the periods between waves, COVID-19 mortality has also been at a higher level than we anticipated.
Figure 3 – Comparing 2023 and 2024 deaths from COVID-19, with a timing adjustment
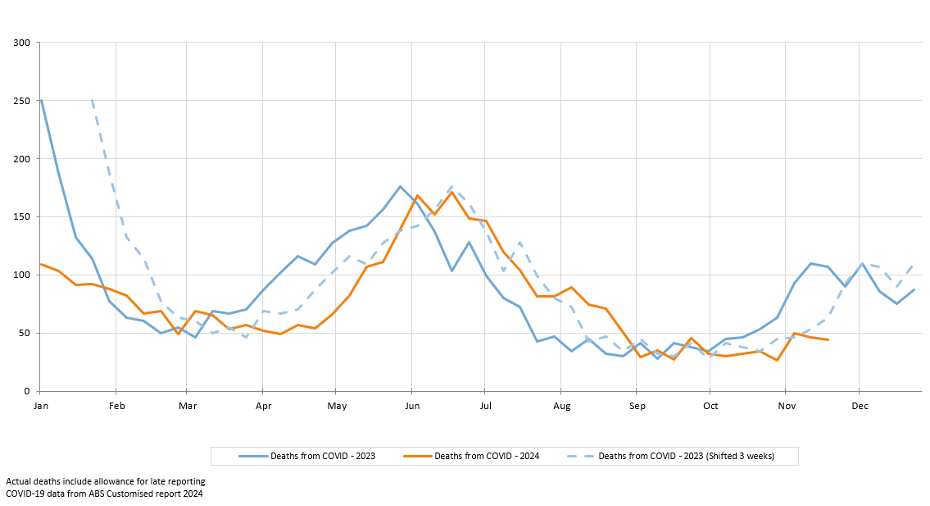
In fact, as Figure 3 shows, COVID-19 mortality has been at similar levels to 2023 for much of 2024, once a three-week adjustment is made for the timing of the winter wave. It is clear that the mid-2024 wave was similar in height to the mid-2023 wave. Two factors explain why the overall number of deaths for the year to date is 13% lower than for the corresponding period in 2023:
- 2023 began with a high peak which was not observed in 2024; and
- a further wave commenced in October 2023 that has so far not been evident in 2024.
Surveillance of COVID-19 PCR tests in New South Wales and Victoria shows that, although there have been relatively short periods of higher positive tests since October 2024, these have not reached the level seen in previous COVID-19 waves.
It should be noted, however, that testing patterns have changed over time; therefore, while this information gives some reason for optimism, it cannot be relied upon to make robust predictions. Similarly, the NSW Sewage Surveillance program has not shown as big an increase in late 2024 as occurred in late 2023.
COVID-19 is a new disease, and its mortality impact is difficult to predict. The first 11 months of 2024 have proven to be materially worse than we anticipated, in terms of both the peak mortality of each wave and the underlying mortality between waves.
Excess deaths in 2024 by cause of death
Table 1 shows our estimate of excess deaths broken down by cause[1].
Table 1 – Excess deaths in Australia (vs. 2023-based expectation) – by cause of death for January-November 2024

In the first 11 months of 2024:
- Total deaths were 1,400 (1%) more than predicted – i.e., the overall experience for the first 11 months of 2024 is slightly higher than 2023 after allowing for pre-pandemic levels of mortality improvement, however this is not statistically significant.
- There were 3,676 deaths from COVID-19, which is 69% higher than predicted.
- Influenza deaths remained high through November, indicating a later peak than in 2022 and 2023, although the pattern of flu was similar to the average of 2018, 2019, 2022 and 2023.
- COVID-19 was a much more significant cause of death than influenza, with five deaths from COVID-19 for every death from influenza.
- Deaths from pneumonia and other lower respiratory disease were also significantly higher than predicted.
- Total deaths from non-COVID-19 respiratory causes were 7% higher than predicted and just within the 95% confidence interval.
- Deaths from cancer have been 2% below the prediction, reversing the trend from 2022-2023.
- Deaths for heart disease, diabetes and dementia were all lower than predicted although we do not consider any of these outcomes to be statistically significant. This contrasts with 2021-2023 where deaths for these causes were significantly higher than anticipated.
- Deaths from other unspecified diseases (where the Australian Bureau of Statistics (ABS) does not specify a cause) are higher than predicted, but not significantly so. This is a catch-all category and a variety of factors are likely to be influencing the outcome.
Data and terminology
The Mortality Working Group has examined the latest Provisional Mortality Statistics, covering deaths occurring up to 30 November 2024 and registered by 31 January 2025, released by the ABS on 28 February 2025.
We have used additional data supplied by the ABS in a periodical customised report[2] in relation to COVID-19 deaths, namely the total number of deaths each week (doctor-certified and coroner-referred) both from COVID-19 and COVID-19 related, defined as:
- deaths from COVID-19 are deaths where COVID-19 is listed as the primary/underlying cause of death; and
- deaths that are COVID-19 related are deaths where the underlying cause of death has been determined as something other than COVID-19, but COVID-19 was a contributing factor mentioned on the death certificate.[3]
A new approach to setting the baseline predicted number of deaths
As detailed in our April 2024 Actuaries Digital article, we have moved away from measuring pandemic mortality impacts to comparing current mortality against adjusted 2023 figures. The new approach predicts 186,300 deaths for 2024 (including 2,400 from COVID-19) compared to 183,700 in 2023, with demographic aging outpacing mortality improvements.
Disclaimer
This excess mortality analysis is intended for discussion purposes only and does not constitute consulting advice on which to base decisions. We are not medical professionals, public health specialists or epidemiologists.
To the extent permitted by law, all users of the monthly analysis hereby release and indemnify The Institute of Actuaries of Australia and associated parties from all present and future liabilities that may arise in connection with this monthly analysis, its publication or any communication, discussion or work relating to or derived from the contents of this monthly analysis.
Mortality Working Group
The members of the Working Group are Jenny Gibson, Cecilia Huang, Jenny Ingram, Ronald Lai, Jennifer Lang, Richard Lyon, Matt Ralph, Michael Seymour, Amitoze Singh, and Colin Yellowlees.
References
[1] As in our previous work, we have estimated the number of coroner-referred COVID-19 deaths based on the experience of late 2021 and 2022. If our estimate of coroner-referred COVID-19 deaths is too high (or low), this will not affect the total level of excess deaths measured; it will just mean that our estimate of non-COVID-19 coroner-referred deaths will be too low (or high) by the same amount.
[2] The latest such report covered deaths from and related to COVID-19 that were registered by 31 December 2024
[3] The COVID-19 deaths covered in this article are distinct from “incidental COVID-19” deaths, namely deaths where the person was COVID-19 positive at the time of death, but COVID-19 was not recorded on the death certificate. These deaths are generally included in surveillance reporting where identified (other than where there is a clear alternative cause of death, such as trauma) but are not separately identified in the ABS statistics.
CPD: Actuaries Institute Members can claim two CPD points for every hour of reading articles on Actuaries Digital.