
COVID-19: Scenarios for Australia pre and post lockdown
What could have happened if governments hadn’t introduced a lockdown in Australia and left it to a largely socially-responsible society to soldier on? And what might lie ahead for Australia in 2020 in respect of continued infections following a relaxation of the lockdown? Matthew Tiong explores these scenarios.
Having contributed to the modelling effort of the Solidarity Fund in South Africa, NMG’s data & analytics teams have recalibrated its COVID-19 model to the experience of several countries. This article reflects some of my initial thoughts, having been involved in the development and calibration of the model for Australia. I’d like to recognise my actuarial colleagues Gary (and son Robert) Scott and Adam Lowe for the great work done so far.
Australia deals well with the ‘first wave’ of COVID-19
At time of writing (early May), Australia had fewer than 7,000 reported infections and fewer than 100 deaths. Unreported and / or asymptomatic infections are by definition, unknown, however some estimations indicate a further 5,000 – 10,000 may have contracted the virus since the start of the outbreak. [To read more about unreported infections in Australia, have a look at Douglas Isles’ article on Actuaries Digital]
Exhibit 1: Infection penetration and case fatality rate by country
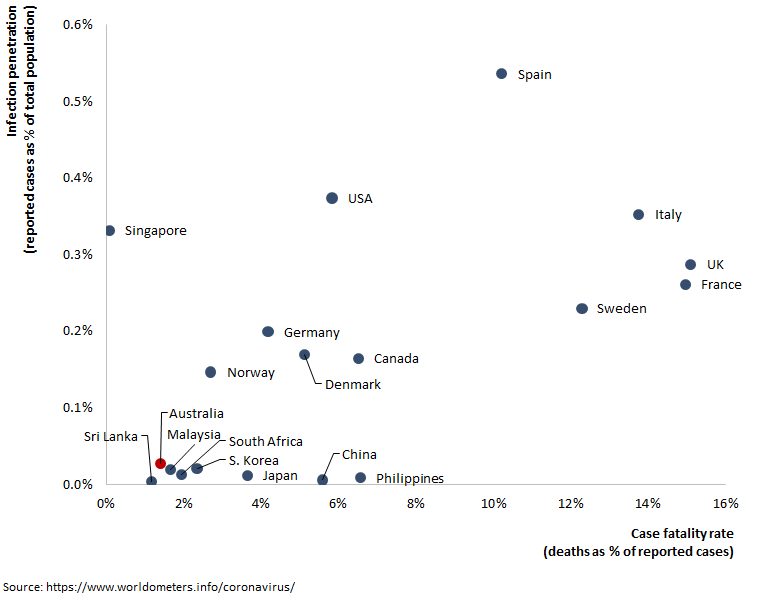
Calibrating the model to the Australian experience has proven to be largely an exercise in selecting reasonable assumptions for the transmission rate (or the often-quoted reproduction number – the average number of healthy individuals to which an infectious person transmits the disease), such that the model produces an estimated number of infections that aligns with the actual number of reported infections. Further assumptions are required to estimate unreported and asymptomatic infections to provide a more complete picture, as well as hospitalisations and ICU days. I’ll save these for future posts.
What might have happened if Australia had not gone into lockdown?
What we saw when we looked at the trend in the number of confirmed infections was that in the early stages (early to mid-March) the disease appeared to be spreading rapidly at a reproduction number of 2.5 – 3. This appears to have been followed by a short period around the middle of March where the reproduction number reduced to 1.5 – 2. This suggests that individual Australians were taking actions that had a positive effect on reducing the spread of infections prior to the state-based lockdowns being implemented.
While this is evidence of the level of personal responsibility that individual Australians assumed to address the spread of COVID-19, the current modelling suggests that if transmission had continued at this rate, the number of daily infections could have risen to a peak of almost ~200k (reported) infections per day towards the end of June.
Exhibit 2: Responsible Australians, but without further intervention
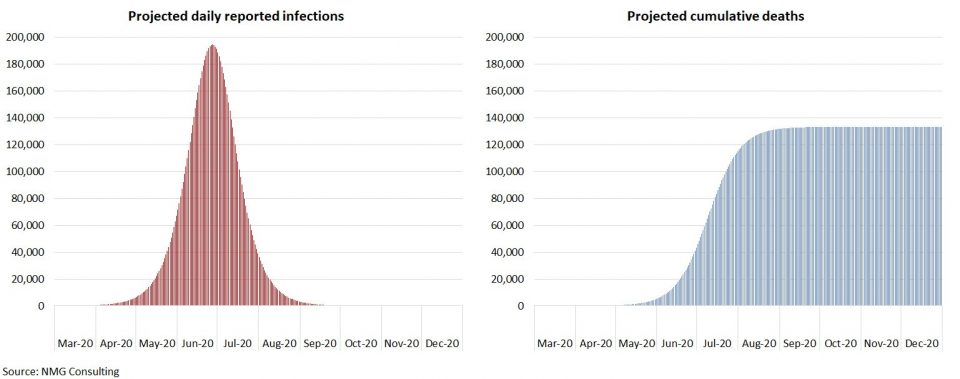
Depending on the assumed infection fatality rate, the number of resulting deaths would have been significant. Our model assumes an infection fatality rate of 1.07%, which we have calibrated using a study of infection fatality rates by age conducted by Imperial College London (reweighted to the Australian age demographic). Based on this assumption, the model projects ~130k fatalities by late August in this scenario, and that is without allowing for a higher fatality rate associated with strained health services, as would have undoubtedly arisen.
This scenario’s embedded flaw is that it doesn’t incorporate assumptions for escalating interventions that Australians would have taken on their own accord to combat the spread of infections. Nevertheless, it presents a strong argument for how significant interventions (whether they be government led or otherwise) are imperative.
Perhaps the emerging experience in Sweden and Japan could be good points of reference, where government led lockdowns were not enforced, with varying degrees of success in containing the spread. Certainly, it makes an interesting case to consider for future strategies.
What might happen as Australia exits the lockdown?
Alternative strategies aside, Australia went into lockdown in late March and the data shows that there was a significant drop off in the number of new infections throughout April. The model indicates that locked down-Australia managed to reduce the reproduction number to ~0.5 from late March onwards.
The question now is, what happens as we exit from lockdown? This will depend on how proactive we will be at continuing our non-pharmaceutical interventions (increased focus on handwashing, the use of masks, social distancing etc). We have tested a range of possibilities by running scenarios using various reproduction numbers. One such scenario assumes that the lockdown restrictions were lifted in mid-May and that the reproduction number increases to, and holds steady at, ~1.3 as a result. Under this scenario new infections start to rise and are projected to reach ~250 (reported) infections per day in mid-September, before we assume that another lockdown (of lesser intensity) will have to be implemented to once again control the spread.
Some may consider these numbers unrealistically high given our success so far. Yet when one considers that children will be back at school, most will be back at work, and that the colder winter months lie ahead of us, it is probably unrealistic to assume infection levels won’t slowly trend up again.
Exhibit 3: A balancing act
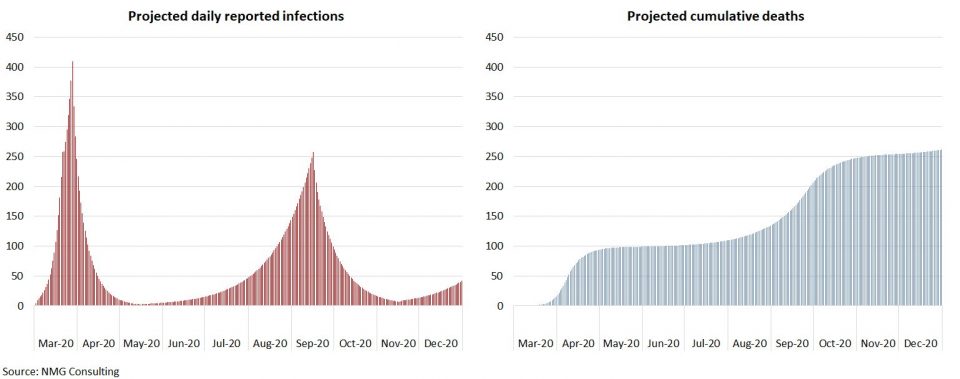
There is a lot of disagreement on the assumptions that underpin just about every COVID-19 model and the potential for model error is undoubtedly very high. Nevertheless, it is still a useful exercise, if for no other reason than to demonstrate how fragile our predicament actually is, and how vigilant we need to be in order to stay on top of the spread while getting back to something resembling our normal lives.
NMG has released a web-based version of an SEIR (Susceptible, Exposed, Infected, Recovered) model for Australia that generates scenarios for the potential development of COVID-19 under a range of possible assumptions defining the spread of infections. Please contact NMG if you are interested.
CPD: Actuaries Institute Members can claim two CPD points for every hour of reading articles on Actuaries Digital.


