The importance of effective measurement, communication and understanding of risk of natural disasters
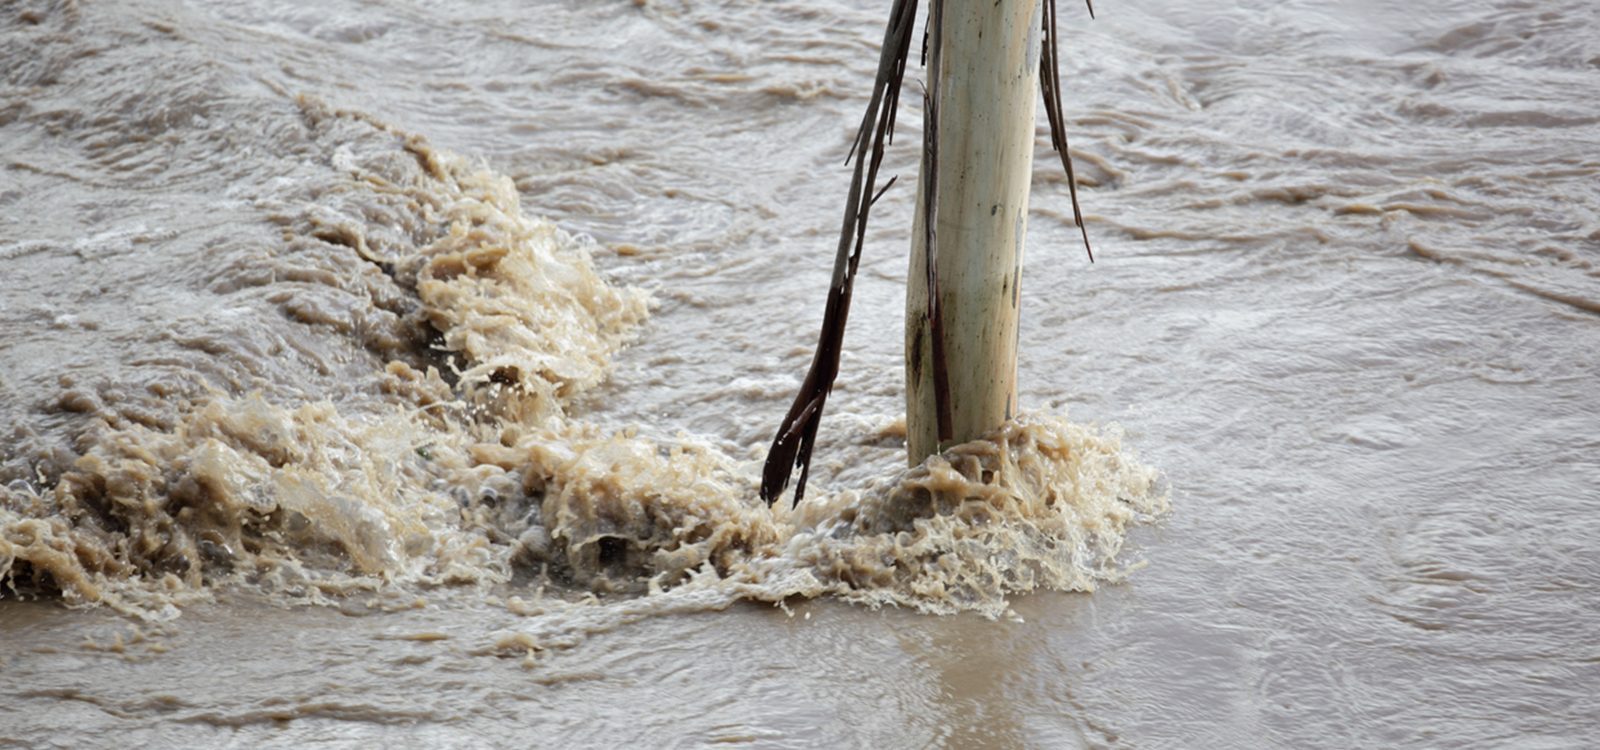
In the media and the general community, it has become common practice to classify natural disasters as a ‘one-in-Χ-year’ event. This phrase can be misleading if interpreted literally, possibly leading people to think that their risk actually reduced because they have 100 years to wait before the next ‘one-in-100-year’ event. This article aims to clear up the murky waters.
Actuaries, catastrophe modellers and the like, ‘model’ natural disasters to inform risk management decision makers of the risk they face in a specified time period, often a year. The most common approach used, is to produce stochastic event simulations, which replicate the occurrences, dimensions, intensity, and movement of the natural phenomena within a year. If the phenomena geo-spatially overlaps with a portfolio of assets, then asset damage may occur, and this may result in a financial loss to the portfolio owners. A large enough number of simulations need to be run, such that the distribution of losses converges (stabilises). The stabilisation of the ‘one-in-X-year’ will vary by the chosen return period, natural disaster type, and the portfolio of assets.
If you simulate 100,000 events and assume there is only one per year, then the one-in-100-year event corresponds to the entry at the 99th percentile, or the 1,000th highest ranked event. If the assumption of one event per year is changed, the meaning of ‘year’ must be adjusted also. This is the mechanical description of a ‘one-in-X-year’ event. The 99th percentile entry can also be expressed as the 1% Occurrence Exceedance Probability. This means there is a 1% likelihood that any event will exceed this amount over the year, while the Aggregate Exceedance Probability is the likelihood that aggregate losses in any year will exceed a given loss amount. Below, we make some observations about a ‘one-in-X-year’ event, assuming one event per year and a one-year simulation period:
- One in every X simulation will have an impact equal to or greater than the result. However, all the simulations represent the same time period. I.e., the next year;
- In any given year, there is a 100/X% chance that the portfolio will experience an impact of at least the ‘one-in-X-year’ event;
- The definition would change if we are ranking the events by losses or physical characteristics. E.g., Flood losses vs peak three seconds wind gust vs 24 hours rainfall;
- The definition changes if we are looking at a single natural disaster type or multiple;
- For most hazard types, the definition is not conditional on past events. This means that if a ‘one-in-X-year’ event occurred this year, the likelihood of it occurring next year is not impacted. However, this is technically not true for some hazards such as bushfire and earthquake;
- The definition corresponds to the simulation area. I.e. ‘one-in-X-year’ flood event for Australia is not necessarily the same as a ‘one-in-X-year’ event for Sydney;
- The ‘impact’ can be defined on the financial cost to repair and replace assets, or it could be defined purely on the intensity of the phenomena. E.g., flood depth.
An important observation is that the ‘one-in-X-year’ event is defined based on deterministic assumptions at a point in time. Year on year, there may be changes in demographics, land use (e.g. building homes on flood plains), building codes, insurance coverage, clean-up costs, and inflation. These changes would naturally alter the ‘one-in-X-year’ event each year.
Furthermore, the occurrence, dimension, intensity, and movement of the natural hazard is predicted to change over time as well. This could be driven by long weather cycles such as El Niño – Southern Oscillation (ENSO), the Indian Ocean Dipole (IOD), and the Southern Annular Mode (SAM), but also climate change.
According to The Geneva Association Task Force on Climate Change Risk Assessment, the impact of climate change for some hazards, such as hurricanes, are strongly masked by natural climate variability and other man-made changes to the risk landscape, while some hazards such as wildfire and local flooding, attribution to already much clear1. So, how often will we see those ‘one-in-100-year’ events in the future? More often than any of us would like.
|
References |
CPD: Actuaries Institute Members can claim two CPD points for every hour of reading articles on Actuaries Digital.


