CPI-Indexed Drawdowns in High Inflation Environments
How have different investment sectors fared against inflation over the past 65-years and what strategies produce the best results for long term CPI indexed income streams?
Using Austmod’s 65-year investment history, this article illustrates how investment sectors performed against “targeted gaps” over Consumer Price Index (CPI), and the success rate of different investment strategies in providing a 30-year CPI-indexed income stream from superannuation accounts in high inflation environments.
Looking at 141 historical investment scenarios that include the high inflation period of the 1970s and 1980s, I analyse the success of:
- a Balanced fund;
- Shares
- Cash;
- a 50/50 mix of cash and shares; and
- a simple, rule-based dynamic investment strategy
in delivering CPI-indexed drawdowns for targeted gaps of 0%, 3% and 4.5%.
The 141 scenarios generated use 65-years of historical annual results with quarterly start dates from June 1959 to June 1994 and a targeted duration of 30-years (the “new” retirement horizon).
Historical data has the benefit of having the actual empirical statistical relationships between (and within) investment sectors and inflation in terms of means, variances, skewness and kurtosis for the distributions of the sectors, as well as cross-correlations and auto-correlations. These are important features that have been discussed previously by Colin Grenfell in his ICA Papers, and in our three recent articles[1] on the significance of negative auto-correlations observed in Australian shares.
The results of the 141 scenarios show that the success rates of generating CPI-indexed income streams depend upon:
- the gap over CPI that is used to price the initial drawdown; and
- the investment asset mix used to support the income stream.
It shows that historically:
- Shares have produced the best long-term average “gaps” over CPI;
- a mix of Cash and Shares performed better than a “typical” Balanced fund across all the observations; and
- a simple, rule-based dynamic investment strategy switching between cash, shares and the 50/50 mix produced significantly improved outcomes.
65-years of historical investment and inflation data
The Austmod database, created by Colin Grenfell, has a history that now extends to 65-years from June 1959 to June 2024, with annual data collected each quarter end. The extensive database includes a variety of investment sectors and inflation data.
Table 1 shows the average CPI increases that were recorded over the 65-year period in each decade and highlights the high inflation that was observed throughout the 1970s and 1980s.
Table 1: Average annual CPI history from June 1959 to June 2024

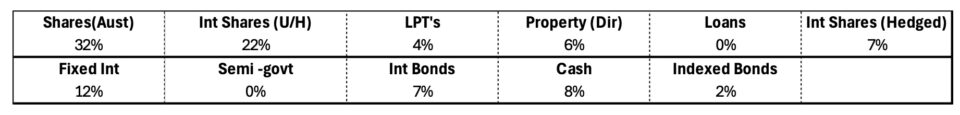
Table 2 lists the investment sectors included in the database and shows the investment sector weightings used to create the balanced fund in this analysis.
Table 2: Balanced fund sector weightings
The compound average annual investment performance over the 65-years for these sectors and the Balanced fund is shown in Table 3. This data includes an allowance for “current” tax effects (such as imputation credits, which are included throughout the data) and typical investment management fees, as suggested in sections 17 and 18 of Colin Grenfell’s ICA2023 Paper.
Table 3: Average annual investment returns from June 1959 to June 2024
The overall investment returns above compare favourably to the average annual CPI increases for the 65-year period which averaged 4.7% and suggest average investment gaps over CPI ranging from 2.3% for Cash up to 8% for Australian Shares.
Typical investment gaps that are presently used in the superannuation industry range from 3% to 4.5%, with the trend appearing to be heading towards the higher end of this range. These ranges sit well within the upper and lower bands that are implied by the average investment sector performance.
However, considering only the average returns does not reflect the variability and sequencing of the investment performance, and there were significant periods in which inflation exceeded investment performance resulting in unsatisfactory outcomes as illustrated later.
Historical probability of achieving CPI + gap
Before examining investment strategies for CPI-indexed drawdowns, it is important to understand how the different investment sectors have performed versus CPI over various time frames.
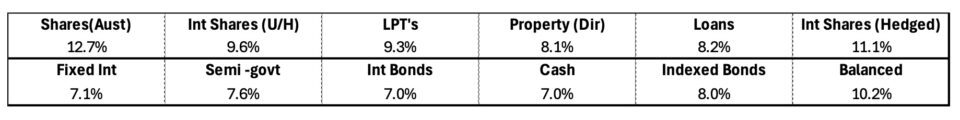
Table 4 incorporates the annual historical data measured quarterly from a start date of 30 June 1959 to an end date of 30 June 2024. It compares the 1-year, 10-year, 20-year and 30-year investment performance for the various investment sectors shown versus the 1-year, 10-year, 20-year and 30-year performance for CPI plus the gap (i.e., CPI+ 0%, CPI+3% and CPI+4.5%).
The percentages shown in the table reflect the number of observations in each of these datasets where
Investment sector return > CPI + gap for corresponding time periods
The results were determined for each quarter commencing 30 June 1959 and ending 30 June 2024. The datasets contained 257 observations of 1-year returns which reduced to 141 observations for 30-year compound returns.
The investment sectors not included in the table did not have any significant features and were left out of the analysis. The best result in each row is highlighted in green, and the worst in pink. The sector names are abbreviated consistent with Table 2.
Table 4: Percentage of observations that exceed CPI + gap

There is generally an increasing percentage of success over longer durations for the 0% and 3% gaps, however, several sectors show a declining trend at the 4.5% gap for increasing durations.
For three sectors in Table 4, these downward trends at a 4.5% gap occur because
- the investment sector returns are below the gap being targeted; and/or
- the pattern of investment returns versus CPI plus gaps are not evenly distributed.
The actual, historical gaps observed for many of the individual sectors throughout the high inflation period were consistently below the targeted 4.5% gap even if they performed well above the targeted gaps in the lower inflation environments.
The pattern of the “cumulative” sector returns for the different gaps is critical when considering CPI-indexed drawdown investment strategies.
The investment strategy to support CPI-indexed drawdowns should recognise that the residual investment capital after (annual) payments are made has a continually reducing timeline, and that as the duration of future payments reduces then the probabilities of exceeding the targeted gaps also generally decline (i.e., the 1-year comparisons to CPI plus gap are usually lower than the 20-year or 30-year comparisons).
The investment strategy for CPI-indexed drawdowns should also incorporate the need to secure CPI-indexed payments in the short term that do not create significant negative impacts on the residual investment capital (large negative gaps to CPI in early years should be minimised).
The combination of investment mix and the appropriate choice of gap have a large impact on the duration and resulting success rate for CPI-indexed drawdowns, as discussed later in this article.
CPI-indexed drawdowns using targeted gaps
The results of how various investment strategies performed in delivering 30-year CPI-indexed income streams across the 141 historical investment scenarios (using annual data for the 141 successive quarterly start dates) are summarised in Table 5.
The investment strategies compared are:
- 100% Cash
- 100% Australian Shares
- a 50/50 asset mix
- a Balanced fund
- the dynamic investment strategy
These sectors were chosen because Shares produced the highest average return, Cash produced the lowest average return and a Balanced fund is the most common investment choice for superannuation accounts. The 50/50 mix of cash and shares is shown for comparison to a Balanced Fund. The simple rule-based dynamic approach is illustrated because of the significant improvement it produced in the outcomes.
The projections commenced using a $500,000 initial investment and initial annual drawdowns of $16,667 (with a 0% gap)[2], $25,042 (with a 3% gap)[2] and $30,050 (with a 4.5% gap)[2]. All these runs index the initial drawdown amount with the previous year’s annual CPI increase.
Table 5 contains the results for achieving 30-year CPI-indexed income streams for each of the targeted gaps, and each of the different investment strategies.
It shows the number of runs that reached the 30-year target in providing CPI-indexed drawdowns, the average residual surplus recorded (expressed as a multiple of the 30th-year CPI-indexed payment) and the minimum and maximum residual surpluses recorded, also expressed as income multiples.
Table 5 also contains the number of runs that did not achieve the 30-year target and the minimum, maximum, and average durations that were recorded for the failed runs.
It is worth noting that most failures for Shares and Balanced funds occurred with start dates prior to 30 June 1975 in the poor investment market environment (i.e., the first 60 quarterly start dates). Virtually all observations after this date reached the maximum 30-year target with the investment market recovery that occurred from mid-1975 onwards.
Table 5: Comparisons of investment strategies
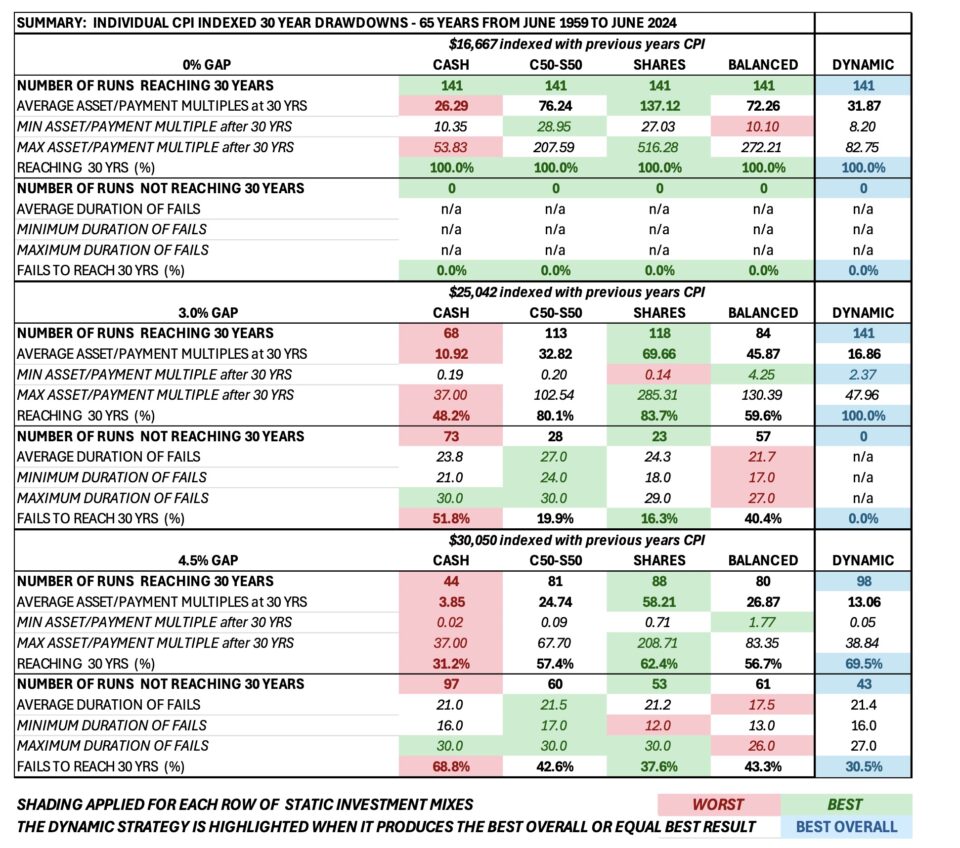
Key findings:
- The simple 50/50 mix portfolio outperformed the Balanced fund in all comparisons.
- A simple rule-based dynamic investment strategy that switches between Cash, Shares and the 50/50 mix significantly improved outcomes for all gaps. It recorded a 100% success rate for the 0% and the 3% gap and the lowest failure rate at the 4.5% gap when compared to the static investment strategies.
- At a 0% gap, all investment strategies delivered 100% success rates for the 30-year objective on all 141 observations, with Shares having the highest residual multiples at the end of 30-years.
- For static investment strategies, the higher targeted gaps require higher weightings in Shares to maximise success rates in achieving CPI-indexed drawdowns however, as expected, this also results in the shortest (worst) durations when the strategy fails.
Conclusion
- A Balanced fund may not be the best “default” option for supporting 30-year CPI-indexed income streams, with better results being produced historically with a simple 50/50 mix of Cash and Shares.
- A simple, dynamic rule-based investment strategy can significantly improve the likelihood of delivering a CPI-indexed drawdown in high inflation environments, such as those that existed in the 1970s and 1980s and produces better outcomes than a static investment policy.
- The choice of investment mix and choice of gap are critical inputs and need to be considered in combination to maximise success rates.
- The use of higher gaps (producing higher initial drawdowns) requires a higher investment risk to be taken to maximise the chances of success. However, this also produces the worst results when it fails. These risks can be mitigated with a rule-based investment strategy.
- Over shorter periods of time, none of the investment sectors achieved 100% success rates in exceeding CPI plus the targeted gaps (e.g., over 1- to 10-year time frames). However, if the investment sector consistently produced an “average gap” above that being targeted, then there was an increasing success rate over longer cumulative time periods with Shares achieving 100% success rates for all targeted gaps over 30-year time frames.
- The use of lower gaps (3% or below) to determine the initial drawdown provides significantly higher success rates in periods of higher inflation such as those that occurred in the 1970s and 1980s.
- These results span the 1970s and 1980s to capture the high inflation environment that persisted. The results also capture the 1987 stock market crash, the 2008 Global Financial Crisis and the recent COVID-19 impacts and hence provide a robust testing environment.
- For the conclusions drawn in this article to be applied into the future, it will require similar patterns, margins and relationships being maintained between investment sectors and CPI, and particularly for cash and shares, into the future. The three recent Actuaries Digital articles[1] on negative auto-correlations provide some support that the pattern of returns is likely to continue for Australian Shares.
A follow-up to this article will use a similar analysis for group annuities with the inclusion of mortality gains.
References
[1] Negative Auto-correlations with Share Investments, 16 January 2024 | Significance of Negative Investment Auto-correlations, 22 January 2024 | More Negative Investment Auto-correlations, 28 March 2024
[2] Starting payments derived by dividing $500,000 by ∑(1/(1+i))^(n-1) with i=0%, 3% and 4.5% and n=1 to 30
CPD: Actuaries Institute Members can claim two CPD points for every hour of reading articles on Actuaries Digital.